

Seven Ways to Look at Stock-Based Compensation & Dilution
SBC can be super esoteric, but a deep dive on investor usage of FCF as a % of FCF/Revenue/Market cap vs % dilution vs DCF and bonus SBC Adjusted Rule of 40 for Software

Bill Gurley and Brad Gerstner had legendary Priceline/Booking CFO Bob Mylod onto the BG2 Pod last week and did an hour long deep-dive into stock-based compensation. They covered the history of SBC in the late 90s, FAS 123, the switch to using RSUs, and what goes on in board rooms with comp committees.
BG2 Pod Episode 5:
I’ve done a bunch of work on dilution and stock-based compensation including finding ground truth on the dilution metric most management teams discuss, dilution at mature big tech companies, executive comp at founder led companies, and BKNG as a tech dilution role model. But one conclusion is that it’s so wildly complex and there’s so many different ways to slice the onion on SBC, dilution, and comp that it’s difficult as an investor to know what’s the right way to look at it. So I wanted to dig into a few different methodologies with the pro/cons of analyzing each. (hint: there’s no golden rule).
If theres one takeaway, it’s that any investor should look at 2-3 different metrics and see where each company falls within both its peer set and the market at large.
Stock-Based Compensation as a % of FCF

One of the issues with SBC is that it’s a non-cash expense, so when you have companies mainly valued on EV/FCF or Free Cash Flow yield, you miss the dilution aspect of the equation. My argument would be that given FCF is the distributable free cash flow available to be distributed to investors, that the important dilution metric is how much of that FCF is being given back to employees as compensation.
The methodology is simple and anybody can calculate it off Bloomberg or through company filings. It’s trailing 12mo SBC expense divided by trailing 12mo FCF.
Pros of Methodology:
Measures % of available FCF being rewarded to employees
Ground truth methodology for mature companies (mature FCF margins)
Simple, straightforward methdology to pull data
Cons of Methodology:
Useless when analyzing FCF negative or close to breakeven businesses
Not a fair comparison for high growth businesses re-investing heavily
Usage of GAAP SBC expense is backwards looking
% Dilution from Statement of Stockholders Equity

This is the “trailing methodology” I’ve used in my previous posts on calculating % dilution. This looks at the trailing 12mo total options and RSUs exercised divided by the beginning of period common shares outstanding. What this measures is % dilution from previous option and RSU grants. What dilution is occuring today from previous dilutive behavior?
This is easily seen in any company filing in the 10-Q and 10-Ks, here is Airbnb from 1Q23:

Pros of Methodology:
Easy to measure and benchmark against every other company.
A true north metric for what’s making it onto the share ledger of a company versus the complexity of grants, cancellations, vesting, etc.
Cons of Methodology:
Ignores prior dilutive options and so likely overstates dilution % (ie. if a company with 100 shares outstanding and 20 RSUs outstanding sees 10 new shares added to statement of stockholder equity this methodology says it’s 10% dilution not 8.3%)
Backwards looking so doesn’t do a good job of telling an investor what a company management is doing *today* or will occur in the future.
For recent IPOs captures a lot of option/RSU dilution from pre-IPO that may still be vesting and isn’t indicative of future behavior on dilution.
% Dilution from Net Option & RSU Grants
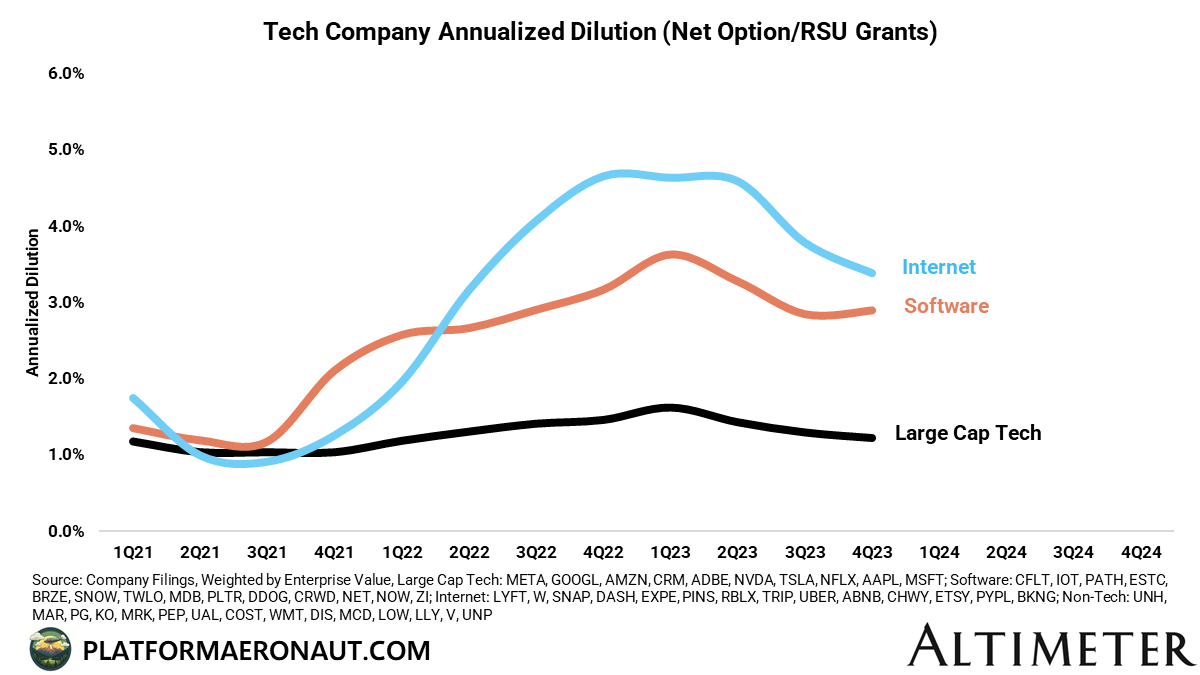
The forward looking version of my dilution calculation is net option and RSU grants (net of cancellations) for the past 12mo over beginning of period shares outstanding from the statement of shareholders equity.
This tells the investor what the forward looking dilution looks like; is the company issuing a crazy number of new shares or are they being more disciplined? We can see the huge share grants in 2H22 and 1H23 as the ZIRP era unwound and stock prices crashed.
Pros of Methodology:
Forward indicator that also accounts for corrective action management teams and boards make (cancellation of awards from layoffs/revisions)
A true north metric for what’s the company is granting today that will eventually make it onto the share ledger.
Cons of Methodology:
Likely overstates dilution for tech companies since it uses basic shares outstanding versus fully diluted (it’s a huge pain to get true FDSO for 100 different companies in a time-efficient manner).
A pain to measure since you need to deep dive into every Option, RSU, PRSU, Stock Units, Restricted Stock for each company and calculate the net “shares” granted.
Stock-based Compensation as a % of Market Cap
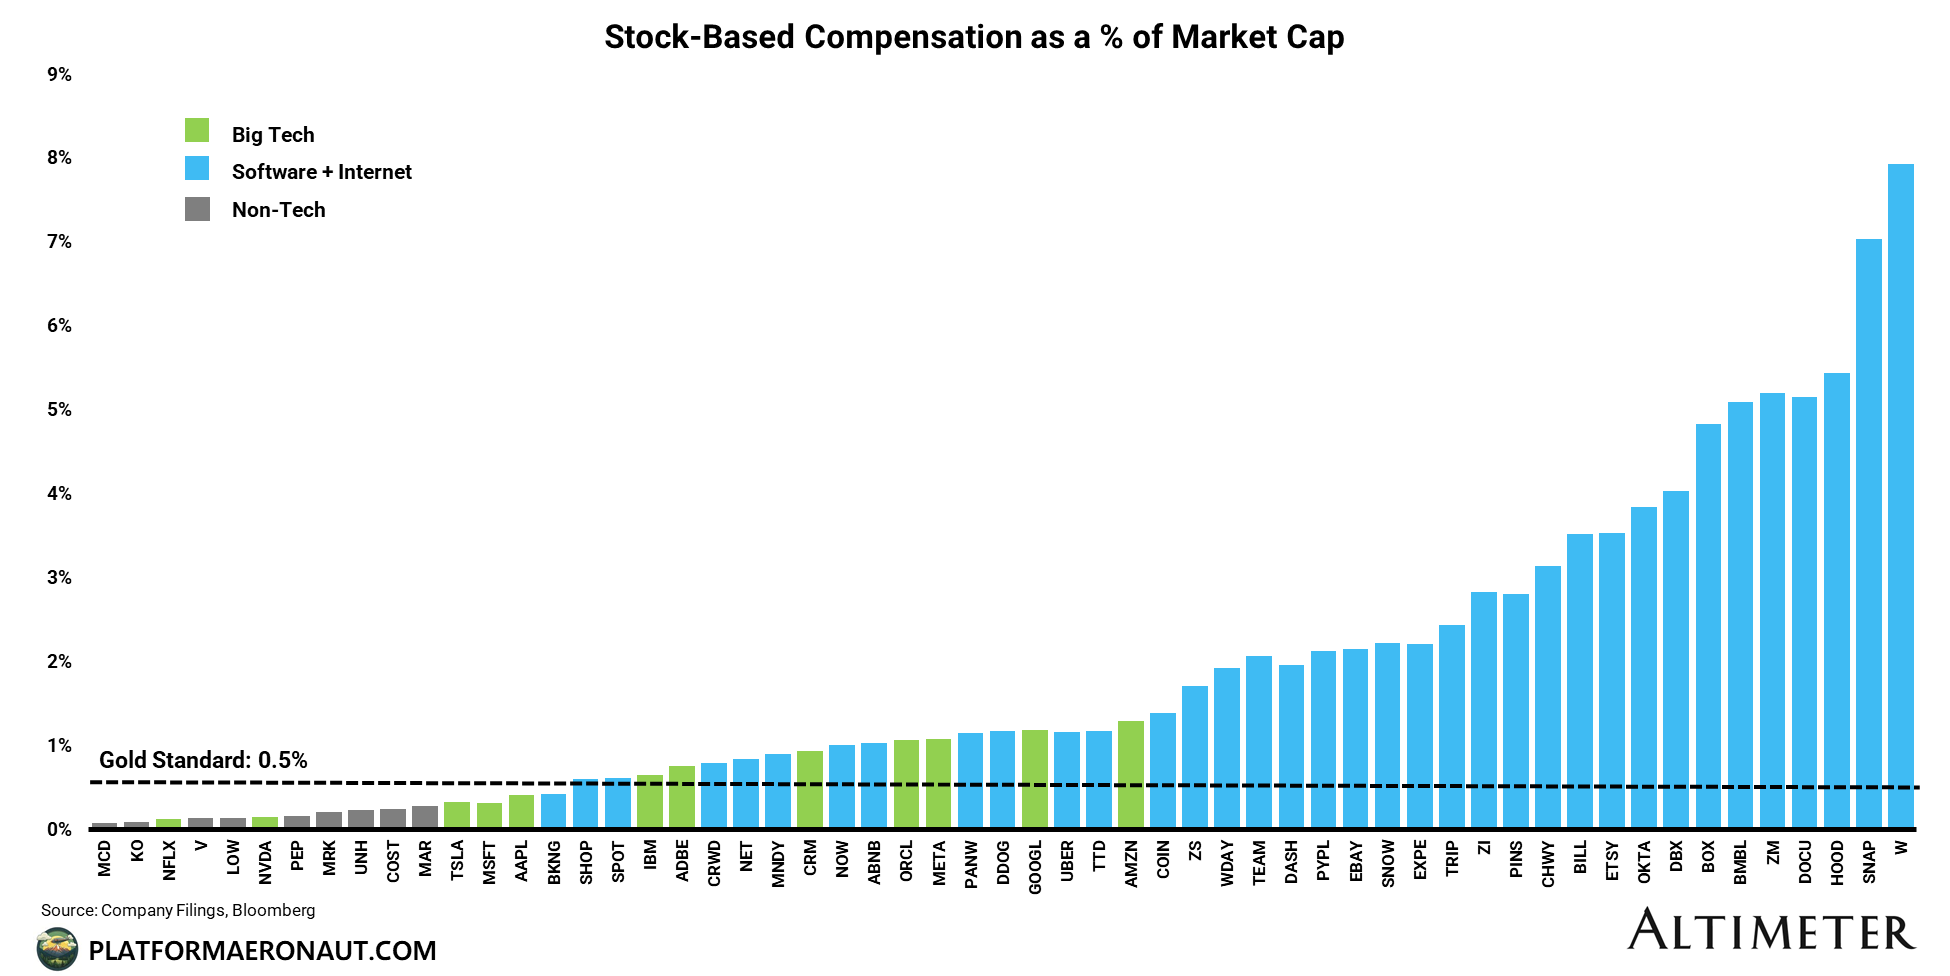
This is super simplistic, it’s TTM SBC expense divided by the most recent quarter’s average market cap. It’s a good short-hand method but I don’t find it terribly useful when it’s no surprise that Coca-Cola has inherently lower SBC as a % of Revenue than Datadog given the differences in human capital the businesses employ.
Pros of Methodology:
Easy to calculate and is a great short-hand for % dilution
Cons of Methodology:
Is more indicative of underlying stock performance as opposed to how much dilution of Free Cash Flow (and stock value) is being given away to employees.
High multiple names screen better than low multiple names despite there possibly being no correlation of health of SBC practices.
Stock-based Compensation as a % of Revenue

Also easy to calculate, it’s trailing 12mo SBC divided bny trailing 12mo revenue. Not a favorite of mine because every company is different in terms of cost structure (people vs COGS vs sales & marketing vs D&A, etc), but I think reasonably useful when cross comparing similar companies. But it’s helpful when saying “sweet jesus HOOD 0.00%↑ gives away 50% of Revenue in SBC, how can they ever generate real FCF and profitability regardless of the rest of the cost structure?”
Pros of Methodology:
Easy to calculate
Good gut check for certain companies
Cons of Methodology:
Not helpful across different sectors/industries with different cost structures and margin profiles.
SBC Adjusted Rule of 40
The big gap in these analysis is how do you compare companies that are high growth like SaaS? That haven’t achieved long term FCF margins? That have employee costs as a significantly higher % of the cost structure? Typical software investors having been using the Rule of 40 for a long time. I figured if we’re really analyzing the trade offs between growth and FCF margins we should do FCF margins including SBC as a cash expense and see how companies stack up.

I’ll caveat this is also using trailing metrics but given the deceleration across the board in software revenue growth I’d assume it looks worse on consensus CY24 numbers.
Frankly some of these are shocking, names like SNOW, TEAM, OKTA, S, and VEEV go from above the line to well below the line. In fact the list of public software companies trading above the notorious rule of 40 when adjusted for SBC is pretty small: MNDY, GLBE, AZPN, PANW, CRWD, QLYS, and ZS.
Pros of Methodology:
Reasonable way to look at the effects of dilution on high growth names
Uses SaaS-common lingo to cross-compare one industry
Cons of Methodology:
Not really dilution or SBC, it’s more of a shorthand for capital efficiency in one specific sector inclusive of all real costs (SBC).
15 Year DCF Comparison of FCF vs FCF-SBC
If you treat SBC as a cash expense and hold shares outstanding flat in a classic DCF model you can see the impact today of long term dilution from stock-based compensation. In this scenario let’s assume a company with the following attributes:
$100m of revenue (growing 30% now slowing to 10% in 15yrs)
$30m of FCF (30% margins growing to 36% in 15yrs)
100m shares outstanding
$0m net debt/share
DCF (12% WAAC, 0% dilution, 3.5% terminal growth): $24/share
Implied fair market value today is $24/share and on a company doing $40m in FCF in CY+1 ($30m + 30% growth + some margin expansion), the implied multiple at $24 is 60x EV/FCF. This isn’t an uncommon multiple for a name to trade at in high growth software (think SNOW, NOW, DDOG)
EV: $24 x 100m = $2,400m (no net debt for simplicity)
EV / FCF: $2,400 / $40 = 60x
DCF (minus SBC with same parameters): $20/share
Implied fair market value is $20/share or 19% lower than the regular DCF. On that same $40m of FCF CY+1 the implied multiple is only 50x EV/FCF which is a 17% discount on fair multiple from the SBC dilution you’re taking.
EV: $20 x 100m = $2,000m (no net debt for simplicity)
EV / FCF: $2,000 / $40 = 50x
Obviously there’s a ton of sensitivity in a DCF on the assumptions, but this is illustrative of the fair multiple a name should trade at today when you bake in stock-based compensation.
Tickers Mentioned: SNOW 0.00%↑ DDOG 0.00%↑ NOW 0.00%↑ GLBE 0.00%↑ AZPN 0.00%↑ CRWD 0.00%↑ QLYS 0.00%↑ S 0.00%↑ TEAM 0.00%↑ OKTA 0.00%↑ VEEV 0.00%↑ HOOD 0.00%↑ KO 0.00%↑ ABNB 0.00%↑
Resources:
The information presented in this newsletter is the opinion of the author and does not necessarily reflect the view of any other person or entity, including Altimeter Capital Management, LP ("Altimeter"). The information provided is believed to be from reliable sources but no liability is accepted for any inaccuracies. This is for information purposes and should not be construed as an investment recommendation. Past performance is no guarantee of future performance. Altimeter is an investment adviser registered with the U.S. Securities and Exchange Commission. Registration does not imply a certain level of skill or training.
This post and the information presented are intended for informational purposes only. The views expressed herein are the author’s alone and do not constitute an offer to sell, or a recommendation to purchase, or a solicitation of an offer to buy, any security, nor a recommendation for any investment product or service. While certain information contained herein has been obtained from sources believed to be reliable, neither the author nor any of his employers or their affiliates have independently verified this information, and its accuracy and completeness cannot be guaranteed. Accordingly, no representation or warranty, express or implied, is made as to, and no reliance should be placed on, the fairness, accuracy, timeliness or completeness of this information. The author and all employers and their affiliated persons assume no liability for this information and no obligation to update the information or analysis contained herein in the future.
I dug into dilution and SBC about 8 mo ago as well and would love to swap notes. My main takeaway was similar in that most investors don't know how the heck to account for it and there is not a universal best practice. Incorporating into a DCF and modeling out FDSO and then backing out FCF / share seemed liked the best method and most practical but was still wild to me that something you would think every smart investor should have a good grasp on was widely misunderstood.