

Tech Company Dilution: Finding Ground Truth
Intellectually honest quantitative analysis of tech company dilution from mega cap (META, GOOGL, NVDA) to software companies (SNOW, MDB, DDOG) to internet (UBER, SNAP, EXPE) compared to non-tech.

I’ve gone through several iterations on dilution and stock-based compensation analysis but I’ve arrived at what I view as the ground truth for how to analyze and measure dilution at public companies. Below is a graphic of top big tech, software, and internet companies and what their most recently reported quarter run-rate dilution is.
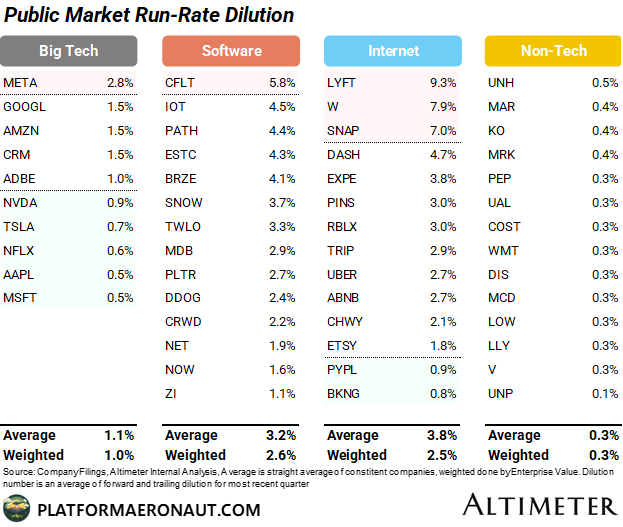
Best in class non-tech companies dilute at only 30bps a year and that’s across a wide spectrum of industries (DIS, LLY, V, UAL, PEP, MAR). Compare that to big tech which although has some gold standard companies (MSFT, AAPL, NFLX) also has META still diluting at 2.8% despite “getting fit” from an operating cost perspective.
Once you move into the mid-cap names in software and internet it gets and remains ugly with dilution running at 2.5-3.0% with some names like LYFT running north of 9%.
Tech Gold Standard (<1%): MSFT, AAPL, NFLX, TSLA, NVDA, PYPL, BKNG
Dog House (>5%): LYFT, CFLT, W, SNAP
Why does dilution even matter?
If you’re hanging at the pod shops or you’re day trading you probably don’t care much about dilution. But anybody owning a business over a multi-year period who expects to compound their money should be paying attention to dilution. Stock based compensation as a % of revenue or FCF is important, but the really simple way to think about dilution is what is the growth in market cap required for the stock price to stay constant over a 5 year period at differing levels of dilution:
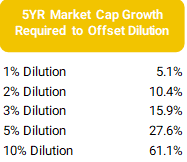
In that same vein: It’s wild to think that LYFT is diluting at 9% per year, the market capitalization of the business would need to double just to keep the stock price flat over an 8 year period.
Methodology
There’s several ways to skin the cat, but what I’ve arrived at as the most intellectually honest is to take the average of what I call the forward dilution method and the trailing dilution method.
Forward Dilution Method (Net Grants)
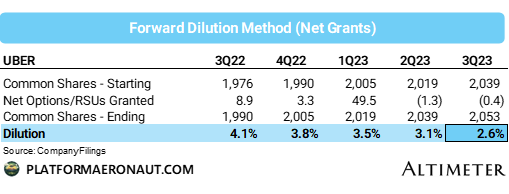
The forward dilution method is an analysis of what net options and RSUs are being granted versus the common shares outstanding for the business. Using Uber above as an example for the trailing 12 months of 3Q23 there were 51m net options/RSUs granted (net of cancellations) on a base at the beginning of the period of 1,990 shares implying run-rate dilution of 2.6%
The way to think of this is what % of the company is the management team granting to employees that will be dilutive in future periods. The disadvantage of this methodology is that it isn’t an accurate representation of dilution today because many of these shares won’t hit the cap table until 3-4 years into the future.
Trailing Dilution Method (Exercised)
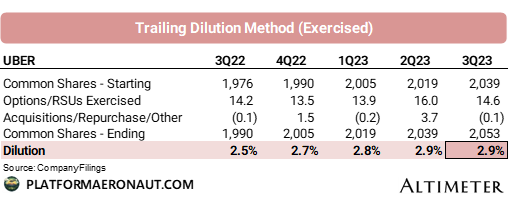
The trailing dilution method is an analysis of what options/RSUs are actually exercised compared to the common shares outstanding at the beginning of the period. Excluded from this is acquisitions, repurchases, ESOPs, etc so we get a true look at just what is exercised from employee compensation.
This is the closest to reality of what “dilution” is, but it misses the view into what future dilution and grants look like and many companies have taken action to limit future dilution throughout 2022 and 2023 that wouldn’t be captured in the trailing methodology.
Combine the Two
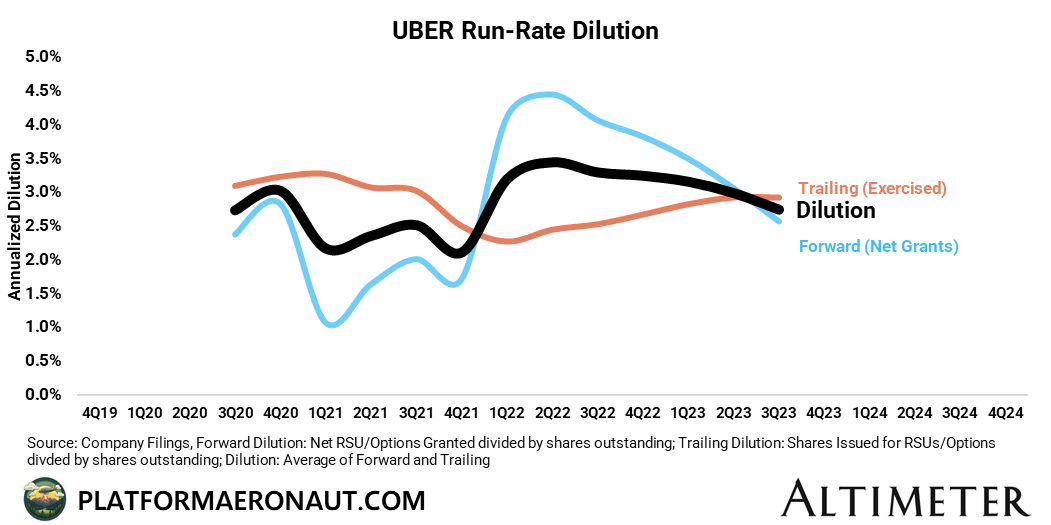
I argue that taking an average of the trailing and forward dilution methodologies gives the most accurate picture of where dilution is for a given company. The chart above shows Uber run-rate dilution over time.
The black line is what I call dilution and is what is represented in the first graphic above, the red-line is trailing, and the blue line is forward. There’s a couple interesting take-aways you can get from looking at all three lines on one graphic.
Forward Dilution below Trailing Dilution = Improving / Better cost management
Trailing Dilution below Forward Dilution = Worsening / High future dilution
Given the significant declines in Uber’s forward dilution as a result of lower grants (and comping a big one-time grant in early 2022), one would anticipate lower overall dilution levels in the future. You can see management taking actions to reduce dilution (and future SBC as a result) as option and RSU grants decline.
Trends since 2019

At a more macro level here are historical dilution run-rates by cohort. For all the conversations about getting fit and management teams buckling down, the reality is that mindset has not translated into lower levels of dilution. Mid-cap internet has actually trended up since pre-covid and large cap tech has a small trendline down if you squint really hard. Software has seen some mild improvement but that trend appears to have reversed itself starting in 2023.
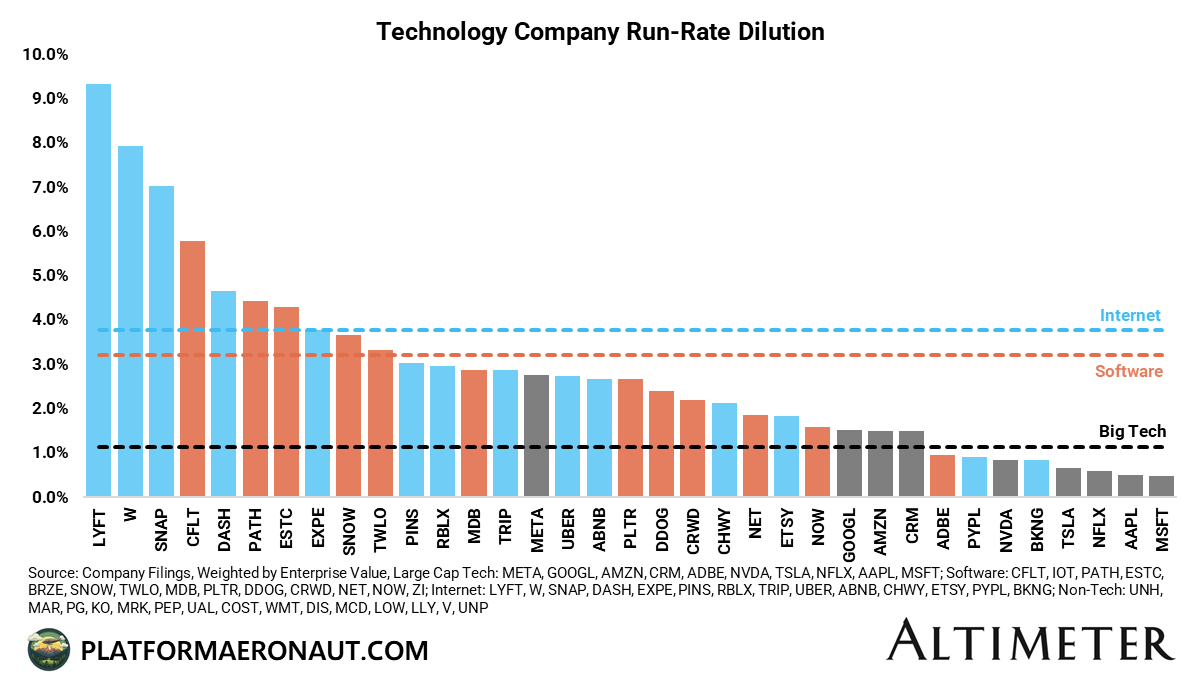
Presented in a slightly different way here is every tech company I modeled out on one bar chart. Excluding the really bad outliers like LYFT, W, and SNAP you could generally argue that mid-cap software and internet dilutes at 3% and large cap tech at 1%.
Individual Companies:
Below are a bunch of charts of individual companies dilution charts that I found interesting. Remember that if the blue forward line is above that you’d expect dilution to get worse than current levels, if the red trailing line is above, then you’d expect dilution to improve.
Internet Companies:
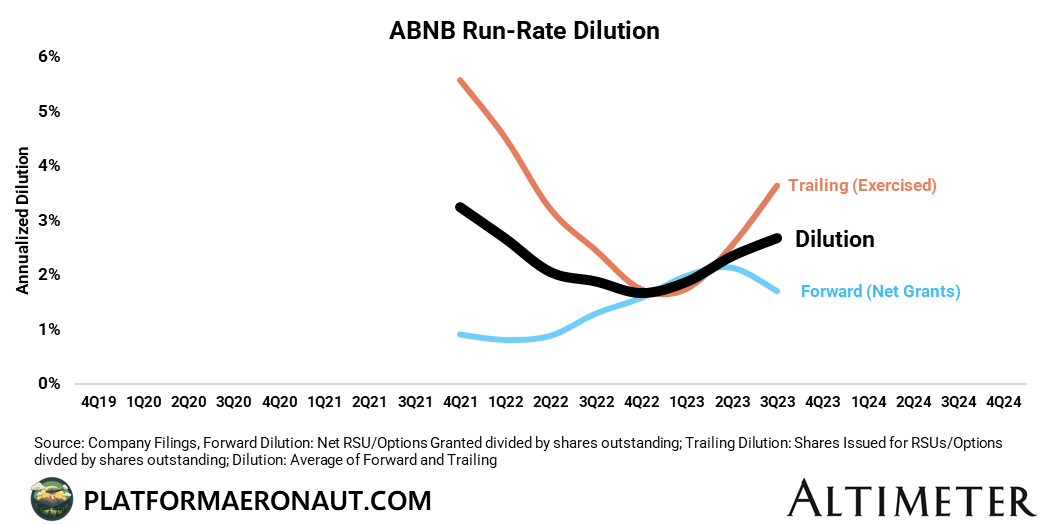
Dilution at Airbnb creeping up into 2023 but forward grants took a step down recently.

Booking has always been the gold standard in mid cap internet territory and that hasn’t changed (at least in terms of forward grants).

Doordash dilution is starting to trend down and most importantly the forward dilution is now well below trailing levels.

Tripadvisor is definitely facing challenges with a core business in cyclical decline but with Viator showing signs of strength. Dilution has crept up over time pretty significantly since Covid.
Software Companies:

SNOW is interesting in that they claimed <1% dilution target at IPO, and now it’s a higher target, and regardless they’re still diluting at closer to 4% than any targets they’re publicly stated.

Confluent dilution is improving, but at 5.8% is the worst out of all the software names I looked at (including IOT, PATH, ESTC, BRZE)

MongoDB is a bit of a model when it comes to high diluting companies continuing to lower forward grant dilution and grow into a lower dilution overall.

Big Tech

Meta dilution continues to creep up aggressively even with significant headcount reductions and “getting fit”

While Salesforce version of getting fit has resulted in MUCH lower net grants of RSUs and options to employees. CRM is finally moving towards ~1% dilution levels.


Tickers Mentioned: META 0.00%↑ MSFT 0.00%↑ AMZN 0.00%↑ GOOGL 0.00%↑ NFLX 0.00%↑ AAPL 0.00%↑ CRM 0.00%↑ ADBE 0.00%↑ NVDA 0.00%↑ TSLA 0.00%↑ UBER 0.00%↑ LYFT 0.00%↑ DASH 0.00%↑ EXPE 0.00%↑ BKNG 0.00%↑ ABNB 0.00%↑ TRIP 0.00%↑ PYPL 0.00%↑ PINS 0.00%↑ ETSY 0.00%↑ SNAP 0.00%↑ CHWY 0.00%↑ W 0.00%↑ RBLX 0.00%↑ SNOW 0.00%↑ MDB 0.00%↑ CFLT 0.00%↑ DDOG 0.00%↑ NOW 0.00%↑ CRWD 0.00%↑ PLTR 0.00%↑ NET 0.00%↑ ESTC 0.00%↑ PATH 0.00%↑ IOT 0.00%↑ ZI 0.00%↑ BRZE 0.00%↑ TWLO 0.00%↑
The information presented in this newsletter is the opinion of the author and does not necessarily reflect the view of any other person or entity, including Altimeter Capital Management, LP ("Altimeter"). The information provided is believed to be from reliable sources but no liability is accepted for any inaccuracies. This is for information purposes and should not be construed as an investment recommendation. Past performance is no guarantee of future performance. Altimeter is an investment adviser registered with the U.S. Securities and Exchange Commission. Registration does not imply a certain level of skill or training.
This post and the information presented are intended for informational purposes only. The views expressed herein are the author’s alone and do not constitute an offer to sell, or a recommendation to purchase, or a solicitation of an offer to buy, any security, nor a recommendation for any investment product or service. While certain information contained herein has been obtained from sources believed to be reliable, neither the author nor any of his employers or their affiliates have independently verified this information, and its accuracy and completeness cannot be guaranteed. Accordingly, no representation or warranty, express or implied, is made as to, and no reliance should be placed on, the fairness, accuracy, timeliness or completeness of this information. The author and all employers and their affiliated persons assume no liability for this information and no obligation to update the information or analysis contained herein in the future.
Thank you for sharing this very interesting data. I was surprised by relatively low dilution at TSLA.
I usually subtract SBC from Cash from Operations to get to an "economic" cash flow, but I guess your method is even more precise. The stunning conclusion is that in a bear market the effect of dilution can become really staggering Thanks again for sharing
I'd love to hear your dilution thoughts on CELH regarding the large preferred shares sitting on the books to Pepsi?