Q3 Global Travel & Leisure Trends
Macro trends and valuation charts for the global travel complex. Despite demand fully recovered and margins at all-time highs, multiples are below both pre-covid and longer-term averages
We’re now multiple quarters past the covid recovery and trends across the board are normalizing. There’s macro concerns about consumer strength and a slew of other challenges for the travel industry (GTF engines, labor wage inflation, high fuel costs). Ahead of the 2023 Skift Conference I wanted to do a very zoomed out view of global travel and leisure trends.
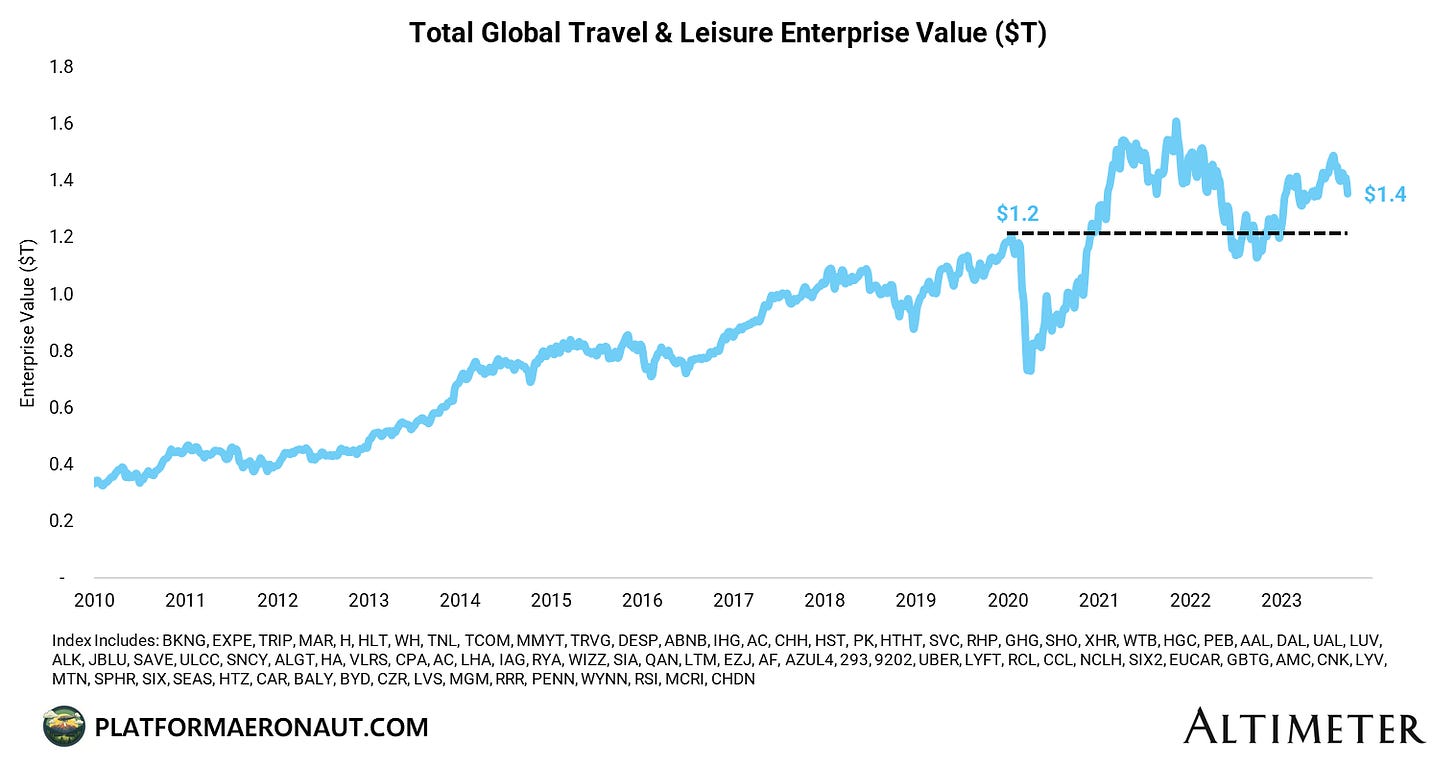
On the above chart you can see significant volatility since Jan 2020. From Jan 2020 to today we’re almost in the exact same place from a total enterprise value perspective on global travel and leisure. (caveat that this is only for publicly listed companies and not a 100% comprehensive list and a bit US-skewed)
There’s certainly some debate on the travel recovery and how far we still have to go. From one perspective you can see that travel demand is back well above 2019 levels:
Cruise lines have been the last laggard but a solid wave season this spring setup a fully recovered summer peak.
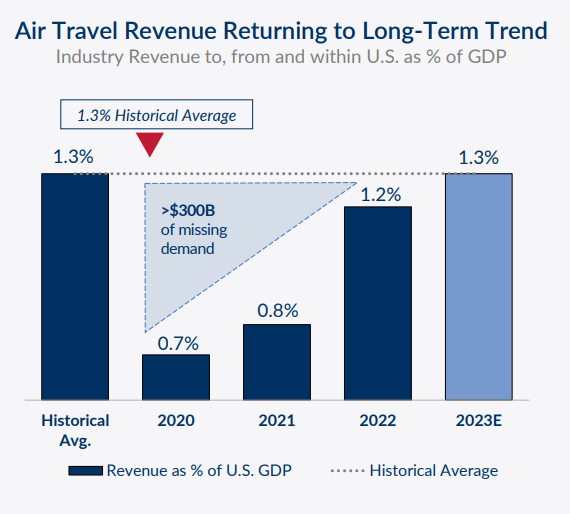
Now that we’ve recovered past 2019 levels of demand, the other way to look at this is how Delta presented it at their 2023 Investor Day which is total air travel spend as a % of US GDP which in my mind tells me that travel spend as a whole is fully recovered and should grow at historical demand levels (1.0-1.5x nominal GDP)
Global Travel Trends
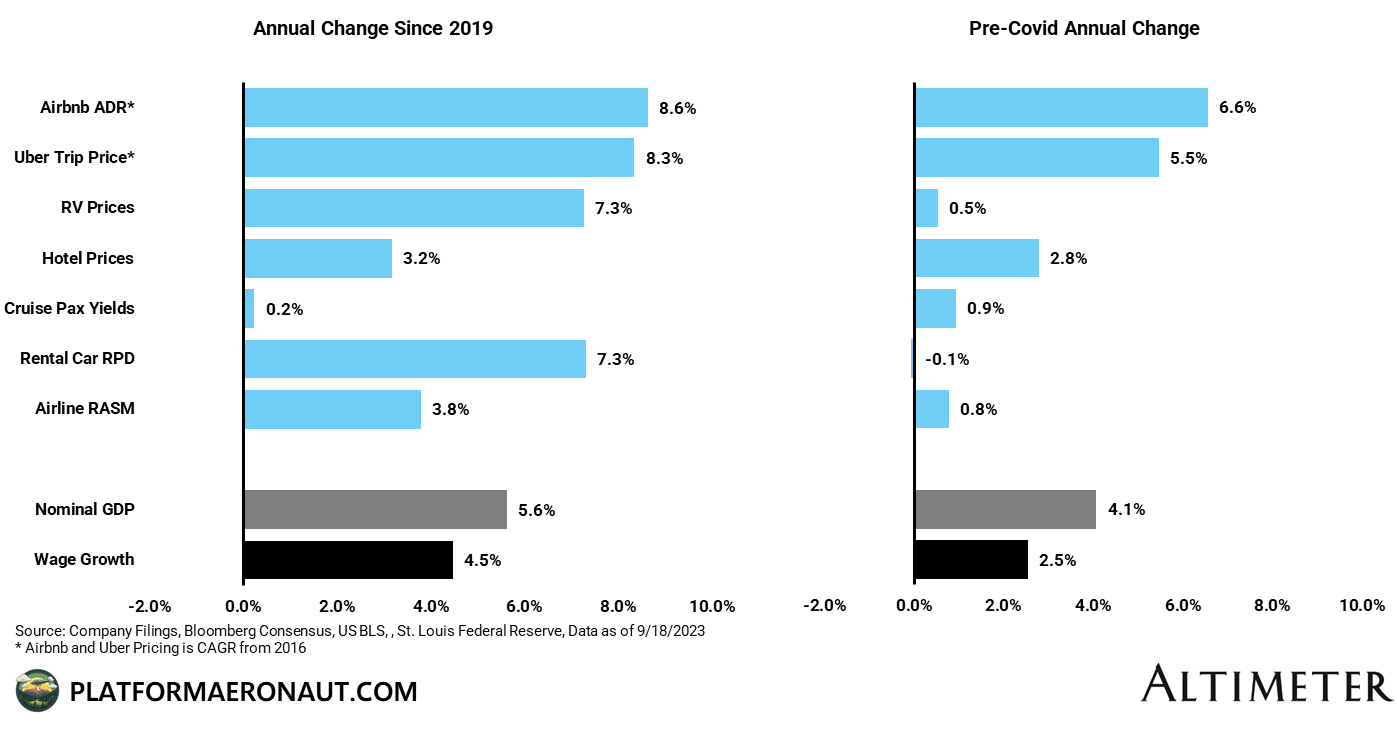
The first thing I want to dive into is a comparison of post covid pricing trends pre and post covid. Historically there is a 1.0-1.5x relationship between the demand for travel and nominal GDP growth and a 0.5-1.0x relationship between wage growth and pricing for travel. The reason for the gap is incremental capacity for travel operators above GDP growth (aka a lack of discipline). At a high level pre-covid these relationships held up as wage growth was a benign 2.5% from 2011 to 2019 and travel pricing was ballpark the same.
Post covid we’ve seen significant inflation both in wage growth (+4.5%) and everything from AirBNB ADRs (+8.6%), Rental Car RPDs (+7.3%), and even RV prices (+7.3%). Even airline RASM was almost equivalent at +3.8% despite a historical inability to push price.
As we’ve come out of covid the simpliest explanation for the narrative is this:
People Hate Lockdowns + Stimulus → Revenge Travel → Revenge Pricing → Peak Margins for Travel Companies:
This is all a grand attempt to see what global travel & leisure fundamentals are on consensus numbers. I’ve certainly missed a few names but I believe this is significantly comprehensive enough to draw conclusions from.
Looking at FCF margins the global travel and leisure complex is at all-time peaks there as well:
But despite the recovery in demand, the pricing strength, and the resulting peak FCF and EBITDA margins, the multiples for the travel complex are below the LT average pre-covid EV/EBITDA multiple:
Interest rates have climbed back to 07/08 levels which has put a damper on multiples, but given the inherent cyclicality of travel and leisure there’s certainly some expectation of compression in margins in the future as well. Consumer and macroeconomic weakness starts to get priced in ahead of consensus estimates actually declining. If we were to start seeing numbers decline it would be expected that multiples would expand as investors start to look towards the recovery.
Hotels & OTAs
There may be some mild pushback on combining the OTAs (BKNG, EXPE, TRIP, ABNB) with the hotels and the hotel REITs, but the reality is that growth rates, margins, multiples, and prevailing fundamentals are pretty damn similar and having more names in an index gives a better high level view. We can see on the chart below that Global Hotel & OTA EBITDA margins are running at peak 27% vs pre-covid average of 22% which was fairly consistent from 2010-2019.
And the market seems to be pricing in sustainability to these margins as sector multiples are trading in-line with pre-covid and historical averages:
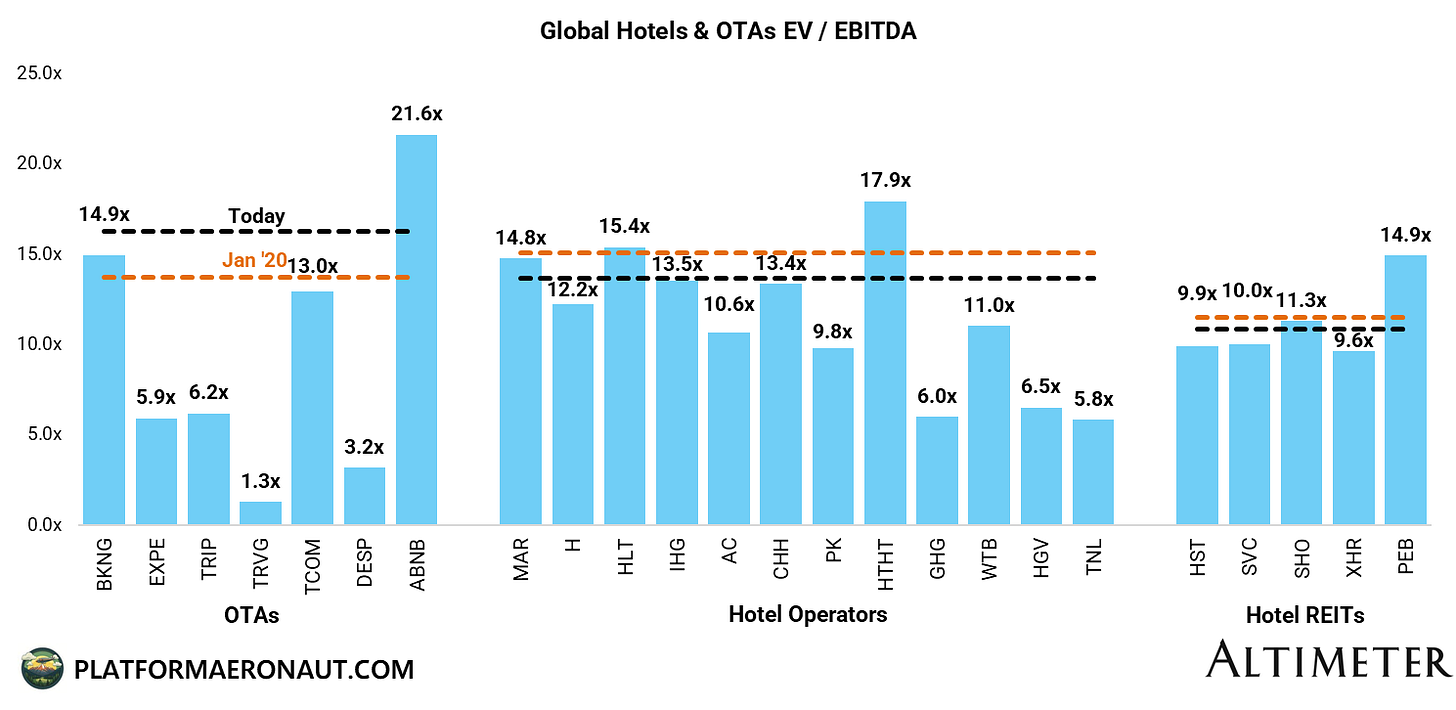
And if we drill down a bit to the three segments below (OTAs, Hotel Operators, Hotel REITs): I’ve put what NTM EV/EBITDA multiples are for each ticker as well as what the EV weighted Jan ‘20 multiple and today’s multiple are for each of the three segments. It’s pretty clear that while OTAs are trading at a premium (mostly due to ABNB inclusion post-IPO), the hotel operators and REITS are at a discount to pre-covid levels.
Airlines
For the global airlines we have $400B+ of enterprise value trading at almost record low multiples:
This is a flashing red sign that the market doesn’t believe consensus estimates. Airline multiples tend to be cyclically bound between 3.5 and 7.5x EV / EBITDAR. At the peak of the cycle when earnings are high investors discount earnings declines and multiples trend towards the lower end of the range. When fundamentals are on their ass we see multiple expansion towards the upper range.
There’s a few reasons they’re trading at low multiples: demand, jet fuel, and peak margin deceleration:
1) Demand Weakening:
We may not have “weak” demand, but at least in the US we have average booked airfares declining year over year and commentary from ULCC 0.00%↑ at the Morgan Stanley Laguna Conference:
“You know, you’ve gone from industry sales being up to flat to now being down versus 2019 and that’s coming at a time that capacity is going up. So — and then the third leg of that stool is fuel. So you’ve got fuel, capacity, and demand all heading in the wrong direction.”
And I’m definitely seeing it in some of the demand and fare data that I track. It’s not surprising that with corporate demand lagging leisure that entering the trough September booking period that things look weak. I wouldn’t be surprised to see a period for the remainder of 2023 where the leisure peaks (Thanksgiving & Christmas) are incredibly strong, but the off-peak trough periods (early Sept, pre-Thanksgiving, first 2 weeks of December) are really ugly for the leisure oriented carriers like SAVE 0.00%↑ LUV 0.00%↑ ALK 0.00%↑.
Jet Fuel Prices Up
If we’re truly heading into consumer and economic weakness it’s hard to believe crude (and jet fuel) prices can sustainably stay in the high $80s/low $90s. But when jet fuel prices rise quickly the sell-side tends to be behind the 8-ball and estimates need to come down. One positive for airlines is that typically in periods of economic weakness you see significant downward pressure on fuel prices which offsets some of that margin pressure.
Peak Margins Decelerating
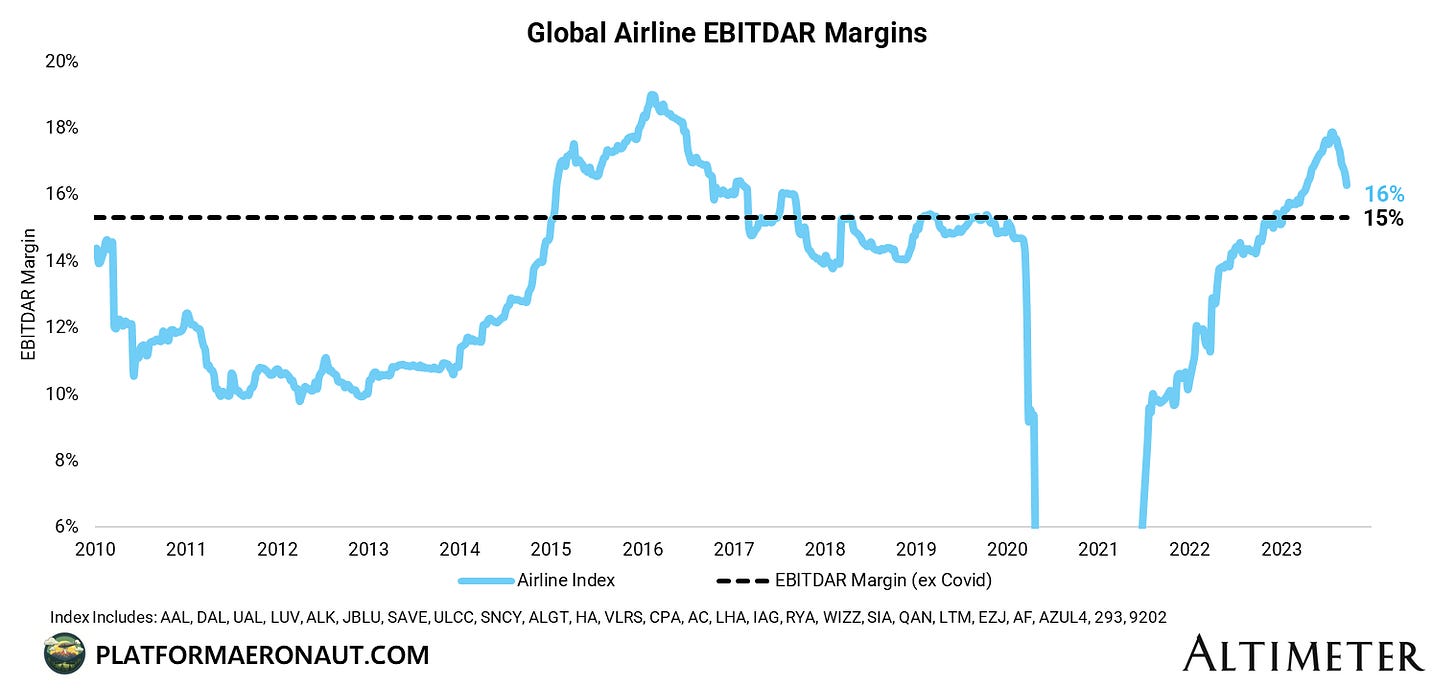
And the combination of demand weakening, jet fuel prices up, and capacity coming back (pending GTF and labor issues), means that we’re coming off recent peak margins. So the market is clearly underwriting to lower margins and absolute EBITDAR than what is baked into consensus numbers.
Legacy vs Low Cost vs Ultra Low Cost Carriers
If you break down the global airlines into the traditional segments of legacy, low cost, and ultra low cost carriers there’s an interesting pattern vs 2019 that appears:
While each of the three is trading below where they were pre-pandemic, the premium that both LCCs and ULCCs trade at versus the legacy airlines has completely evaporated. LCCs are actually stuck in a tough spot where on an EV weighted basis they’re trading at a discount to the legacy names as they’re squeezed on both end but network and corporate travel strength from the legacies and low cost / low fare on the ULCC front.
Other Travel & Leisure Names
I kind of lumped everything else together despite different business models to attempt to view from a 40,000 foot level, but here is the skew of EV / EBITDA multiples vs Jan ‘20 for the cruise lines, rental car names, ridesharing, casinos, and general parks & entertainment:
Cruise lines: The only sector trading at higher multiples than in Jan ‘20 but this is mostly explained by the delayed recovery versus the rest of travel (a couple quarters behind), so I would expect it to normalize over the next 6 months as numbers roll. Especially because the debt load and shareholder dilution from covid was oppressive so these companies are all in significantly worse shape than in Jan 2020.
Rental Car: Trading at a big discount but with significant increase in fundamentals and earnings that is a big unsustainable and hyper-cyclical. Rental cars have benefitted enormously from low depreciation expense on cars due to high used vehicle values as well as peak revenge travel post-covid. It’ll normalize (but not before CAR 0.00%↑ continues to buy back the whole company with excess FCF)
Rideshare: Premium multiple for the winner UBER 0.00%↑ and trading in line with the rest of travel for the loser LYFT 0.00%↑. Significantly growing profitability year over year and no good comparison to pre-covid when these guys were burning cash hand over fist.
Casinos, Parks, & Entertainment: Can’t say I’m a particular expert on these to opine on the fundamental reasons for where the multiples are vs pre-covid, but I wanted to ensure their inclusion in the high level analysis on multiples and margins.
Editor’s Note: Feel free to reach out or comment any questions, push-back or straight up disagreements on the methodologies. This was my best attempt to really look at the entire travel and leisure complex from a 40,000 ft level.
Tickers Mentioned: DAL 0.00%↑ UAL 0.00%↑ AAL 0.00%↑ LUV 0.00%↑ ALK 0.00%↑ ALGT 0.00%↑ MAR 0.00%↑ BKNG 0.00%↑ EXPE 0.00%↑ H 0.00%↑ HLT 0.00%↑ ABNB 0.00%↑ UBER 0.00%↑ LYFT 0.00%↑ RCL 0.00%↑ CCL 0.00%↑ NCLH 0.00%↑ CAR 0.00%↑ HTZ 0.00%↑ SEAS 0.00%↑ SIX 0.00%↑ LYV 0.00%↑
Resources:
Sources used in this post include Bloomberg, consensus estimates, and company filings
The information presented in this newsletter is the opinion of the author and does not necessarily reflect the view of any other person or entity, including Altimeter Capital Management, LP ("Altimeter"). The information provided is believed to be from reliable sources but no liability is accepted for any inaccuracies. This is for information purposes and should not be construed as an investment recommendation. Past performance is no guarantee of future performance. Altimeter is an investment adviser registered with the U.S. Securities and Exchange Commission. Registration does not imply a certain level of skill or training.
This post and the information presented are intended for informational purposes only. The views expressed herein are the author’s alone and do not constitute an offer to sell, or a recommendation to purchase, or a solicitation of an offer to buy, any security, nor a recommendation for any investment product or service. While certain information contained herein has been obtained from sources believed to be reliable, neither the author nor any of his employers or their affiliates have independently verified this information, and its accuracy and completeness cannot be guaranteed. Accordingly, no representation or warranty, express or implied, is made as to, and no reliance should be placed on, the fairness, accuracy, timeliness or completeness of this information. The author and all employers and their affiliated persons assume no liability for this information and no obligation to update the information or analysis contained herein in the future.


