

Ridesharing Q4 2022 Review: Dispersion
Uber's keeps executing, Lyft train wreck continues

TL;DR
Uber continues to execute and grow mobility segment EBITDA margins through operating leverage, reductions in consumer incentives, new products, and a healthy driver supply.
Lyft taking an enormous hit to Adjusted EBITDA as a result of accounting for insurance reserves plus a weak Q1 revenue guide vs consensus.
Driver supply seems much healthier with both Lyft and Uber commenting on the good supply-demand balance.
Uber Q4 2022 Mobility Results
With Uber and Lyft having reported I figured I would do a quick overview of the state of the rideshare industry. I’ll do a follow up on delivery once we get results from DoorDash next week. I’ve posted this before on twitter, but here is an updated chart of Uber’s TTM mobility segment EBITDA margins (as a % of GBV).

Uber reports segment EBITDA which isn’t terribly applicable when comparing to Lyft or other platform/marketplace businesses. There’s a significant amount of overhead expense that isn’t baked into the cake. My methodology to clean this up is to allocate the overhead expense to the mobility and delivery segments weighted by the % of total GBV that each segment generates. Through this lens we can see that Uber has continued to march up and to the right on EBITDA margins for mobility.
Why do Uber mobility margins keep expanding?
Operating Leverage
Mobility GBV growth in Q4 was +31% Y/Y (+10% vs 4Q19) while fixed expenses were flattish (Fixed expenses = operations and support, R&D, G&A all ex-SBC)

Reduction in customer incentives:
Through 3Q22 the consumer incentives per trip was $0.26 vs $0.38 in 4Q19 (for combined mobility+delivery). Numbers for 4Q22 will be released in the 10-K once it’s filed, but it’s a reasonable expectation that this continues to step down as rationalization continues.
Healthy driver supply:
Driver supply was +35%, new drivers +34%, surge levels down below 20% in January, and generally less driver incentive pay.
New products:
Uber One, advertising, reserve trips, hailables, upfront fares, UberX Share are all either new initiatives, new products, or returning products from pre-pandemic.

Interesting Stats from Release / Conference Call:
Uber hit 2B quarterly trips and 100m mobility customers
Reserve trips accounted for $2B of GBV and 50% of these trips are incremental (wouldn’t have otherwise occurred)
New products accounted for $6B of Q4 GBV growing 100% Y/Y and were 20% of the growth
Upfront fares are expected to be rolled out globally by YE23
Mobility Journey advertisements are 3% put-through and $45 CPMs
Lyft Q4 2022 Mobility Results

Lyft accounting finally caught up with them and the SEC “urged” them to include insurance reserves in their Adjusted EBITDA metrics (Lyft was adamant they were not required by the SEC to do so). Q4 Adjusted EBITDA was -$248m vs prior guide of $80-100m (to be fair they beat guidance on their old adjusted EBITDA).
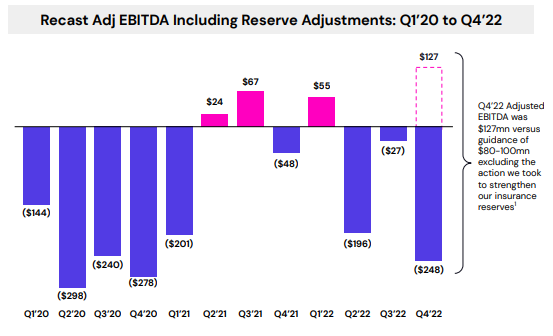
Subscale + Insurance Costs = Pain
It’s my understanding that Uber cleaned up all of their insurance issues awhile ago but Lyft has been struggling to do so for awhile. Ridesharing is truly a scale and network business and being smaller and more geographically concentrated is really rough on gross margins including insurance reserves.
It also hasn’t helped that as a result of vehicle price and maintenance expense inflation the insurance costs for the entire industry has gone up. It’s hard to do apples to apples EBITDA margins on GBV because Lyft doesn’t disclose Gross Bookings. This is more a directional chart but if you apply Uber’s legacy mobility take rate (excluding UK business model adjustments), you can compare this chart to Uber’s above:

Interesting Stats from Release / Conference Call:
Ride conversion rates were down in Q4 as driver supply was below demand resulting in an increase to prime-time (“surge” pricing)
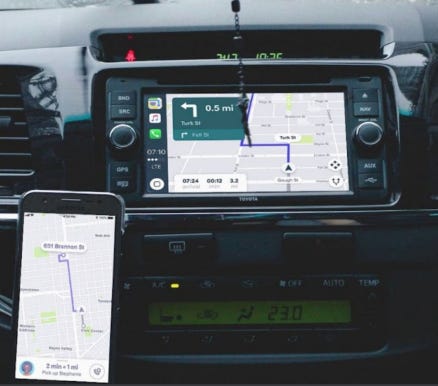
More than 60% of rides are powered by in-house maps up from <1% last year. 2/3 of drivers who try Lyft Maps CarPlay stick with it as primary form of navigation.

Lyft CarPlay integration Upfront information is available on 100% of rideshare rides on the network.
Lyft expects to cut stock-based compensation expense by >50% to $400m in 2024.
Lyft raised base fare prices in Q4 but in January when Uber removed fuel surcharges it forced Lyft to roll those back.
Net-net: Uber executes, Lyft executed
Market reactions varied dramatically, Lyft plummeted 30% post-market on their earnings release due to a) the adjustments to adjusted EBITDA and b) a weak Q1 revenue guide blamed on seasonality. Uber continues to fire on all cylinders by continuing to grow mobility GBV every single quarter and expanding margins and inherent FCF generation from that side of the business.
Uber’s network effects appear to finally be showing up in the numbers and are especially apparent when comparing to Lyft.
Tickers Mentioned:
UBER 0.00%↑ LYFT 0.00%↑ DASH 0.00%↑
Resources:
This post and the information presented are intended for informational purposes only. The views expressed herein are the author’s alone and do not constitute an offer to sell, or a recommendation to purchase, or a solicitation of an offer to buy, any security, nor a recommendation for any investment product or service. While certain information contained herein has been obtained from sources believed to be reliable, neither the author nor any of his employers or their affiliates have independently verified this information, and its accuracy and completeness cannot be guaranteed. Accordingly, no representation or warranty, express or implied, is made as to, and no reliance should be placed on, the fairness, accuracy, timeliness or completeness of this information. The author and all employers and their affiliated persons assume no liability for this information and no obligation to update the information or analysis contained herein in the future.