


The US robotaxi fleet on my tracker crossed 6,000 vehicles this month, roughly 2.5x where we sat a year ago. Uber has committed $10B+ to its AV program and this week it was reported that Waymo wants to double its fleet to 8,000 by year end 2026 and hit 20,000 by the end of 2027. Those headlines together frame two things: 1) Robotaxis are finally scaling and 2) Uber is spending to defend against disintermediation.
But I think that framing gets the math backwards. The question everyone keeps asking is “who wins the robotaxi race?”, but the question that actually matters for Uber is a lot simpler: Does the rideshare pie get bigger faster than 1P networks take slices of it?
6,176 Robotaxis: The Scaling Curve Finally Looks like a Curve
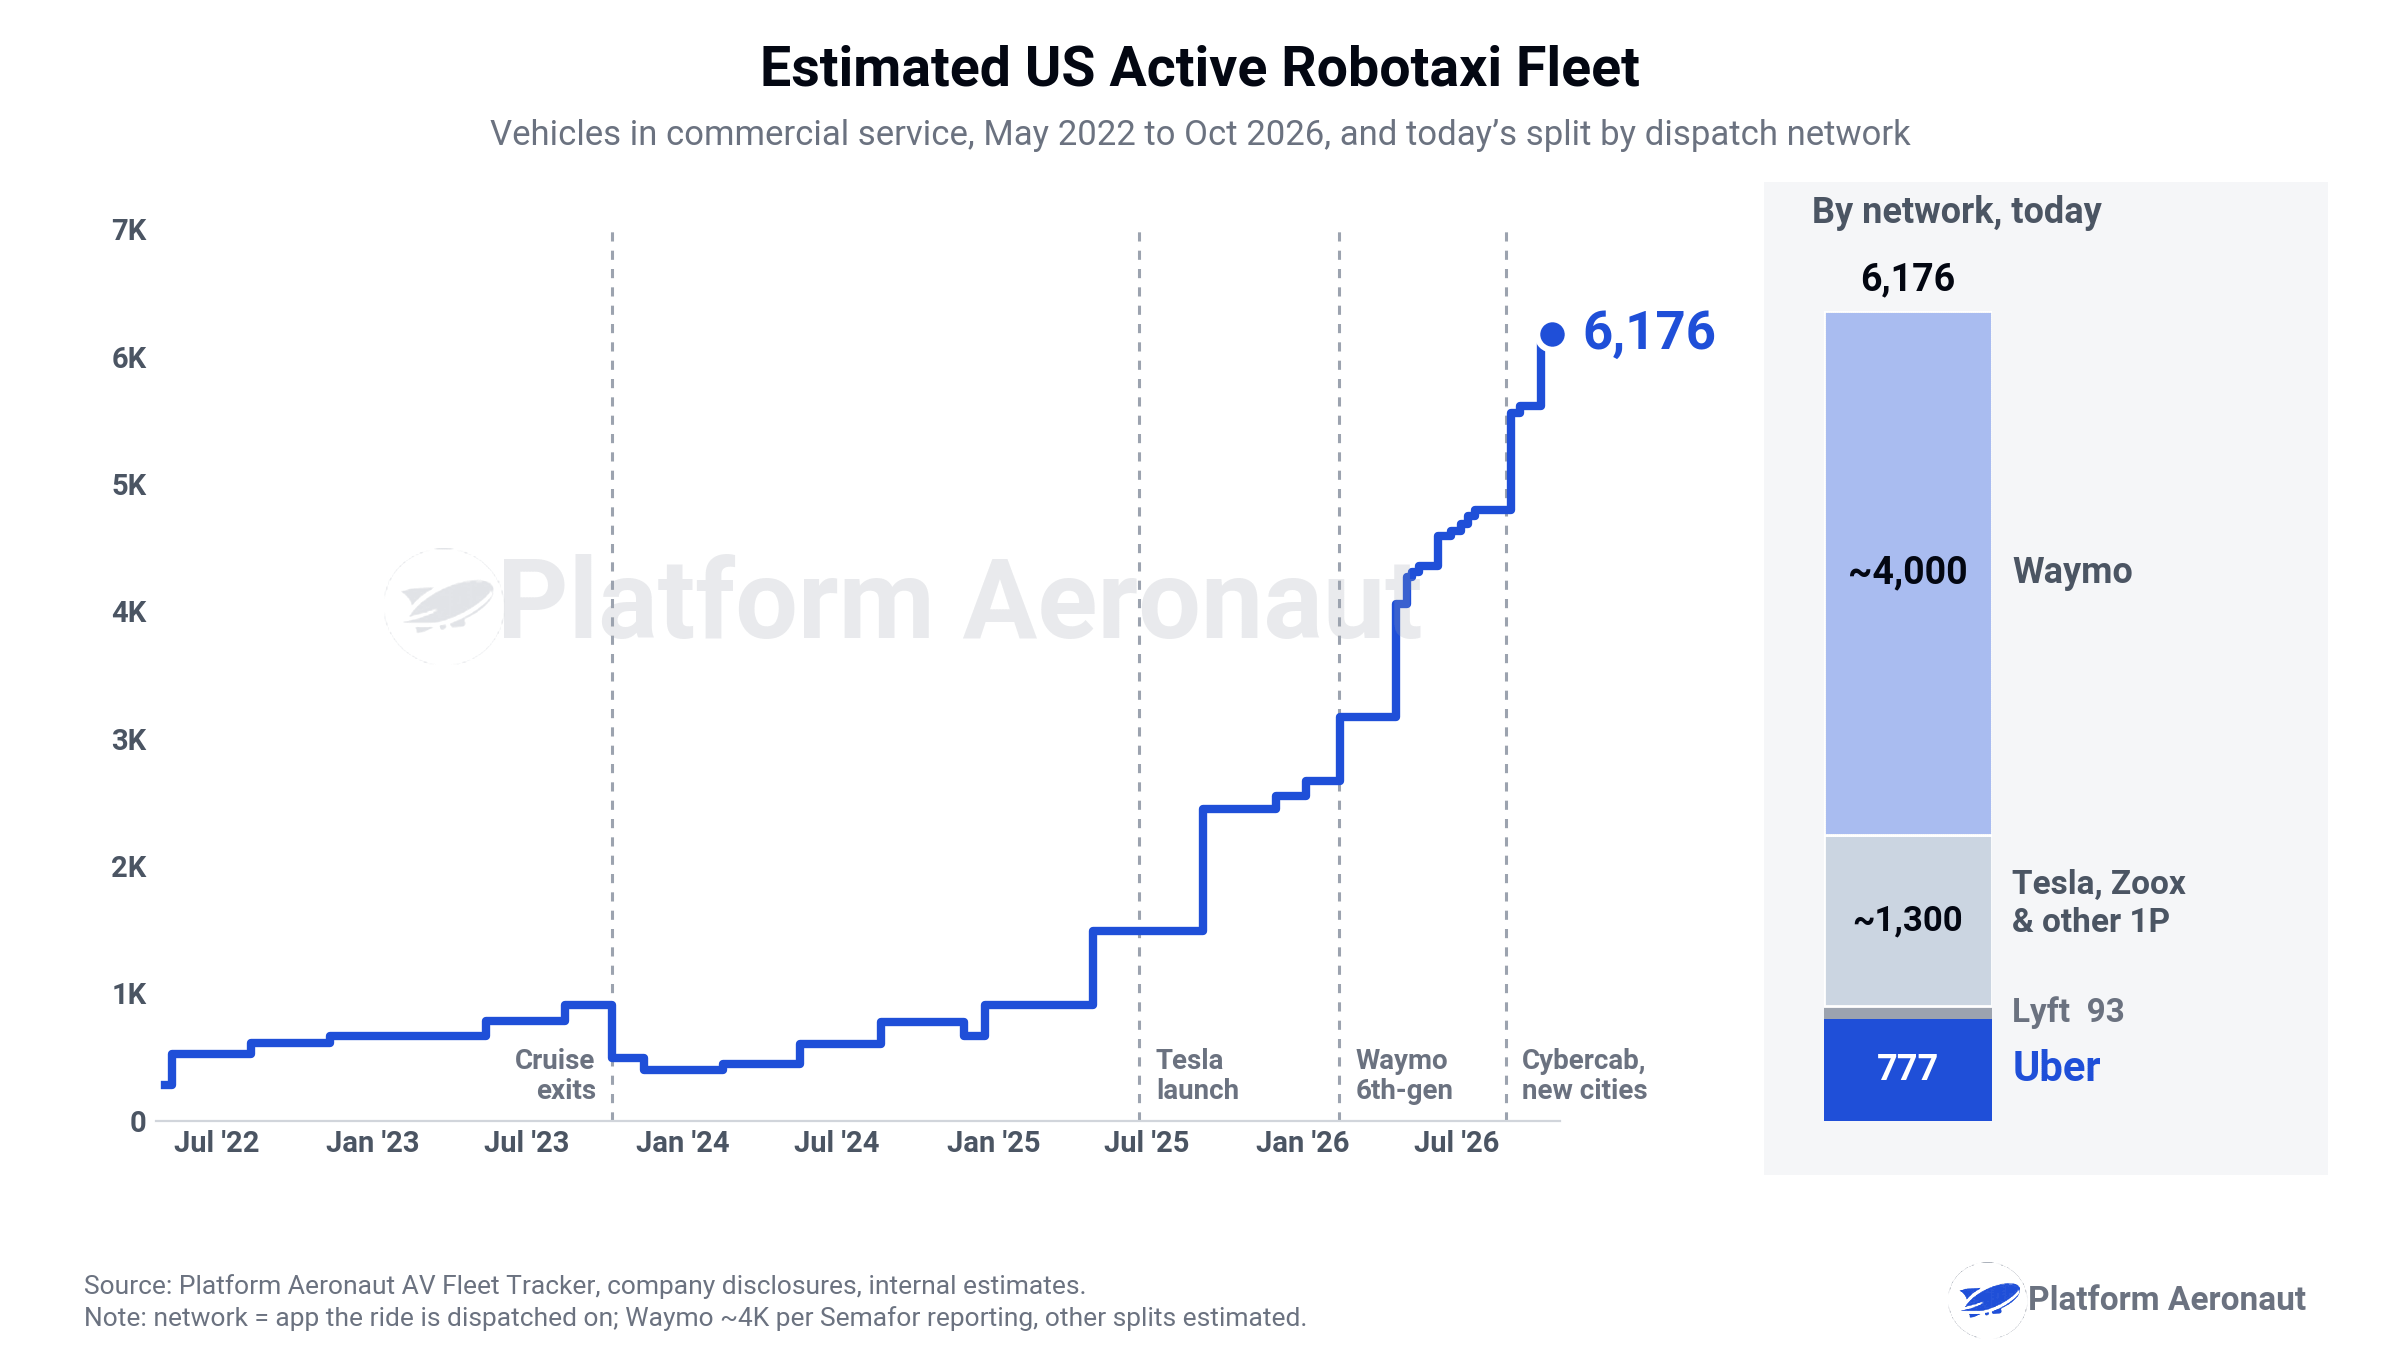
The US commercial robotaxi fleet is almost 6.2k today and roughly 60% of that was added in the last twelve months. For most of 2022 through 1H25 the fleet went sideways. We’re finally hitting escape velocity in 2025 and 2026 with Tesla launching in Austin, Waymo adding cities, and the Waymo 6th-gen platform hitting the road this year. Net adds are accelerating quarter over quarter, which is the 2nd derivative that actually matters.
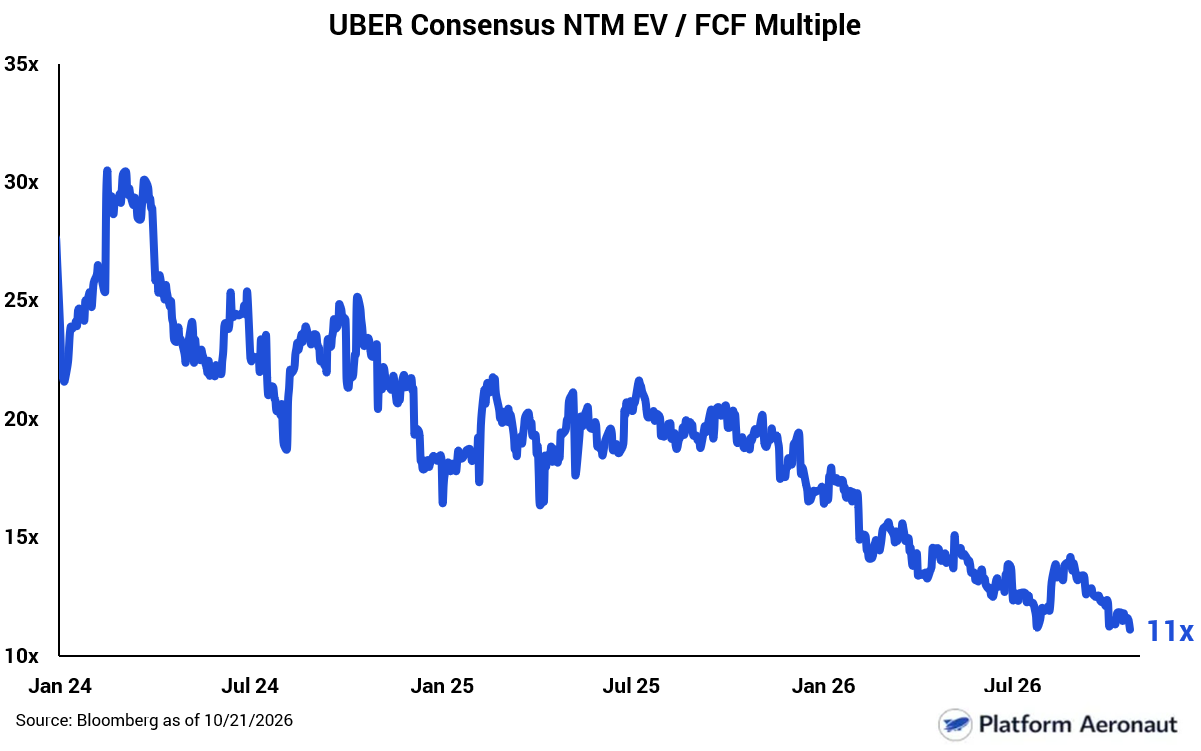
And as 1P autonomous vehicles have continued to deploy, Uber’s consensus EV/FCF multiple has continued to decline. While the business is going to generate over $11B of FCF NTM and it’s compounding at >20% while bringing share count down, the multiple has gone from 17x to 11x in 2026 alone. This tells us what the market believes today:
Let’s put the 6.2k vehicles in context though, it’s 0.6% of the active US ride-hail fleet and ~1% of US ride-hail trips. 1% of ~10.8M daily trips is ~110k AV trips a day or ~18 per vehicle which squares with Waymo’s reported 500k weekly paid rides on 3.8k vehicles. It’s real, it’s growing, but it’s still a rounding error.
Building the Fleet to 2030: 225k Vehicles
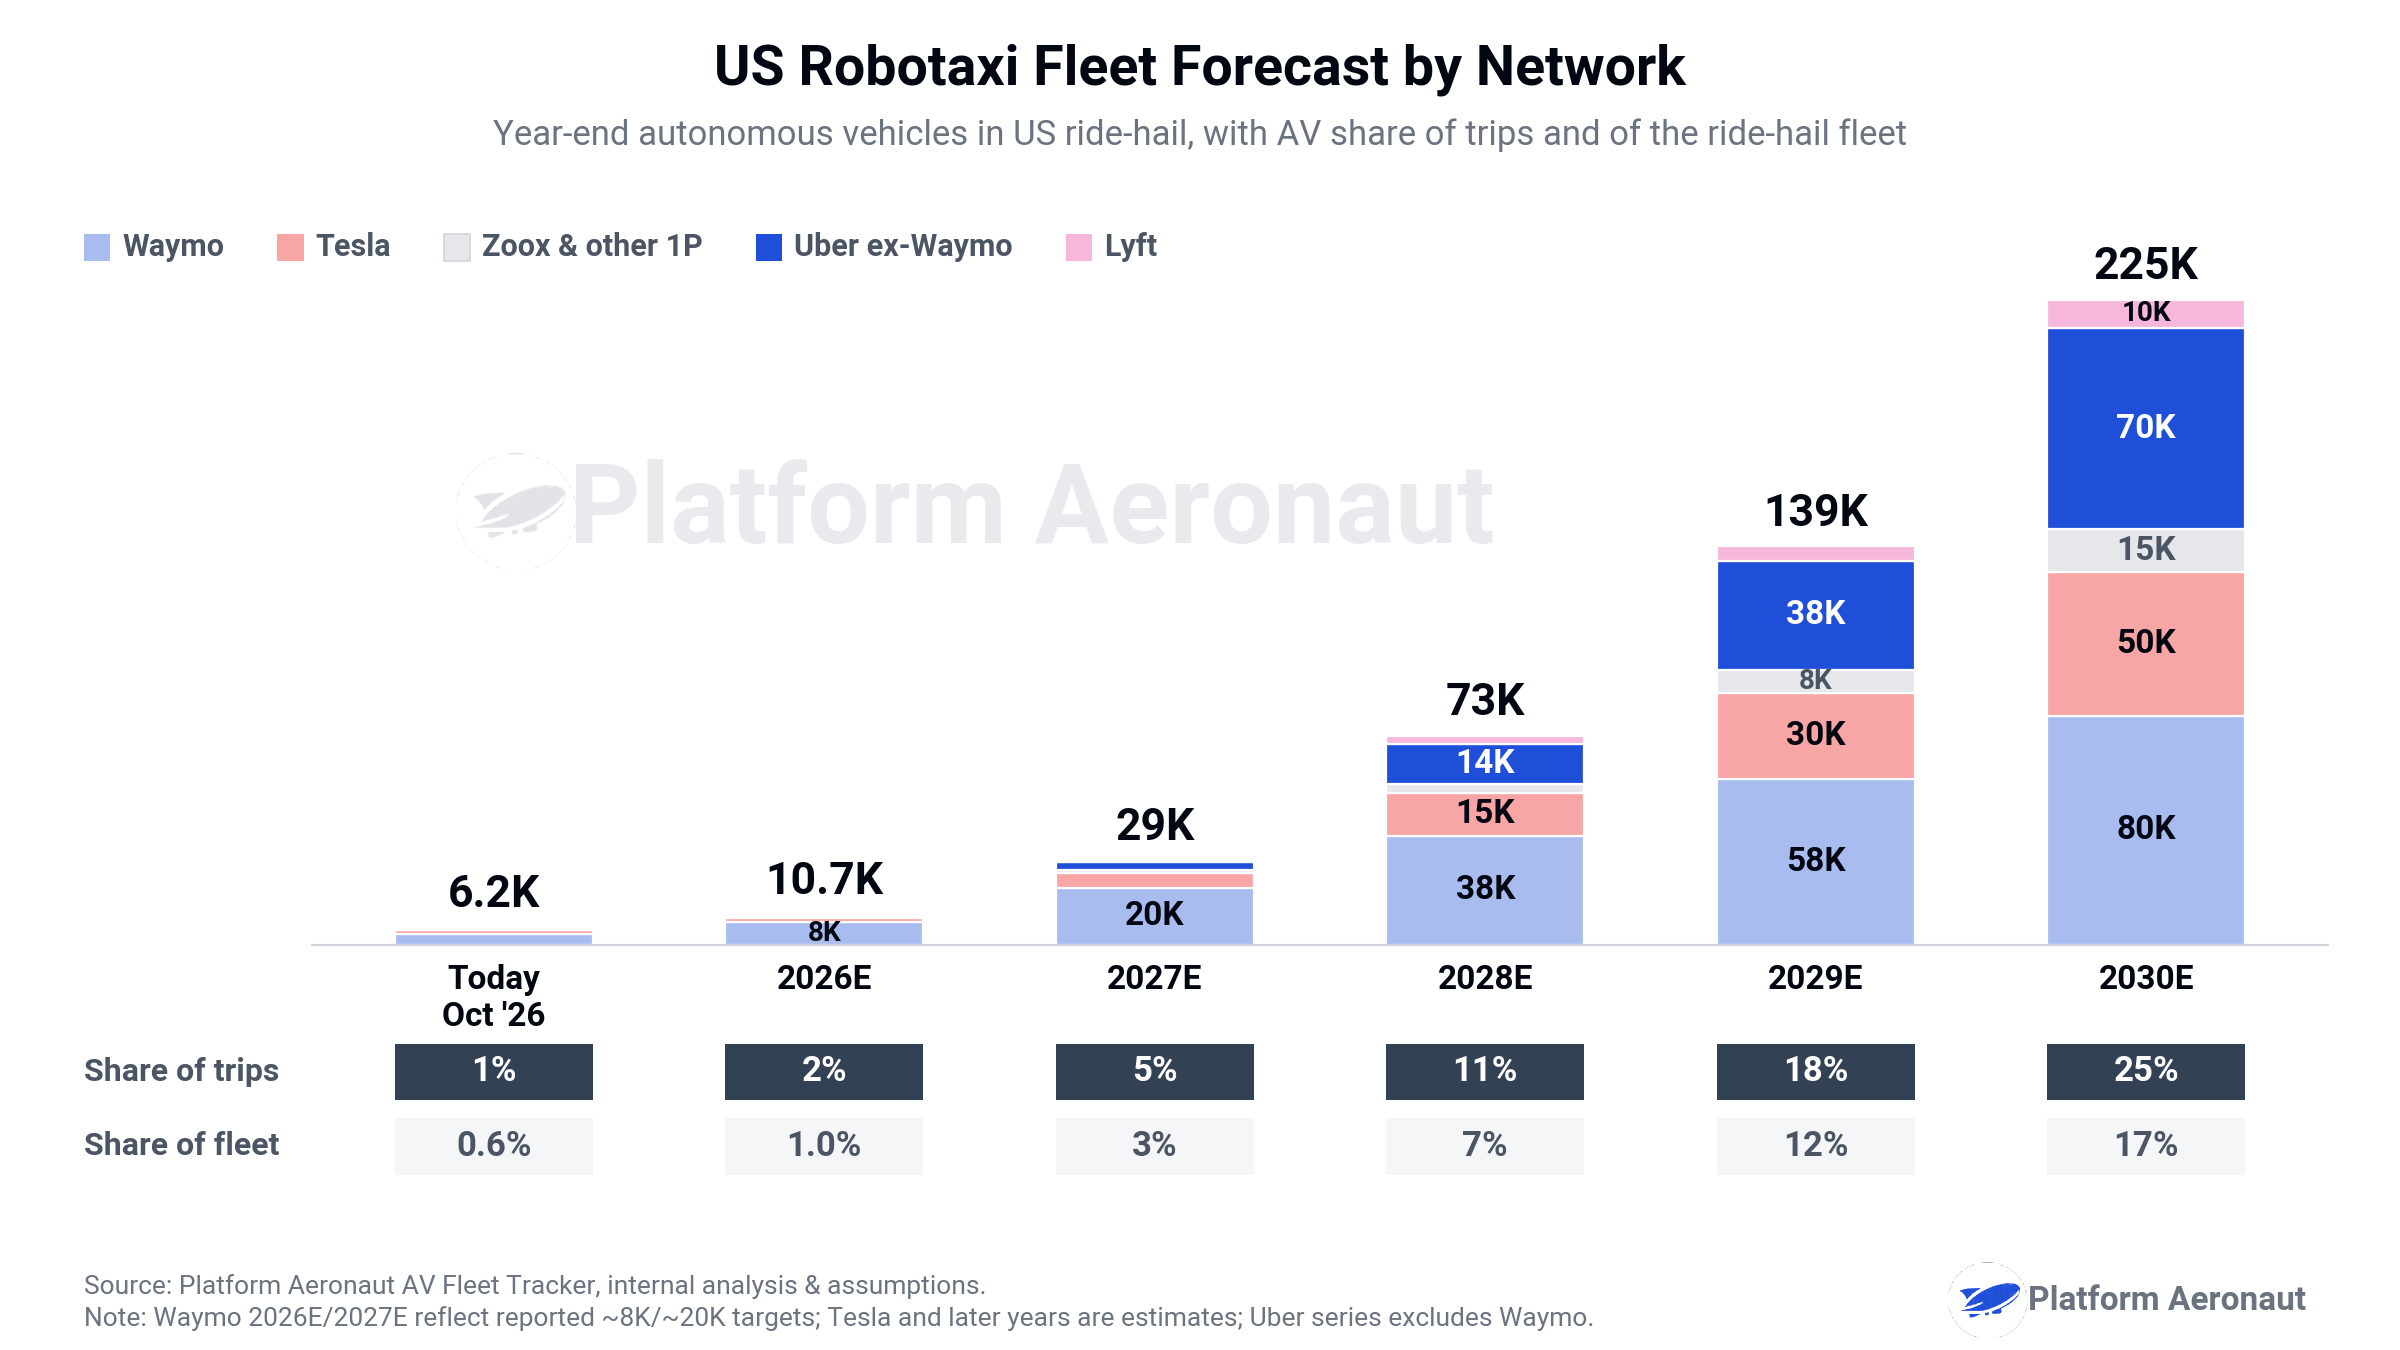
My base case has the US AV fleet reaching 225k vehicles by 2030, which will account for about 17% of the ride-hail fleet doing about 25% of total trips. The shape is slow then steep as 2026 and 2027 are permit and depot years and then we see real scaling in 2028-2030 where Cybercab, Waymo, Zoox, and Uber’s Nuro-Lucid/Rivian/VW/NVDA programs start to scale.
To be clear this is not a model where Waymo or Tesla stumble. The 1P networks still end 2030 with 145k vehicles or 64% of the fleet and still add the most vehicles in absolute terms.
Semafor reported that Waymo is targeting 8k vehicles by YE26 and 20k by YE27 up from just over 4k today. I’m taking those at face value and then building Waymo out to 80k vehicles in 2030.
Tesla is a much harder call, but my swag is 1.5k by YE26, 5k by YE27, then scaling to 50k by 2030. That’s real Cybercab volume but is far short of the rhetoric from Elon. Tesla’s own Cybercab lead said 2.5k vehicles in one year would make him extremely happy, while 50k in 2030 is well under 1/2 of a year of the 125k annual unit capacity Tesla cites. The dichotomy of this plus a history of overpromising and underdelivering makes Tesla’s plans difficult to forecast.
Tesla’s new Robotaxi safety site is the best disclosure we’ve gotten, but it cuts both ways. There have been zero injuries, airbag deployments, or pedestrian and cyclist hits, but that’s only on ~3.1M unsupervised miles since late January across six cities (~95% in Texas), or roughly 12K miles a day. That’s the work of something like a hundred fully utilized robotaxis, there’s no unsupervised Vegas mileage yet despite the 5,000-car permit, and it’s a sliver of Waymo’s rider-only miles.
For Uber there are a few reasons this is not as scary as the headline implies.
Lenders just underwrote $5B of debt against Waymo’s fleet economics, which tells you AV utilization is becoming a financeable asset class. Utilization is exactly what Uber sells to every non-Waymo AV owner.
Although behind on deployments right now, Uber goes from under a thousand vehicles on network today (of which some are Waymo which’ll offload by 2028), to 70k by 2030 which is 31% of the US AV fleet and second only to Waymo.
Partner commitments for Uber are approximately 120k globally, with 35k+ from Nuro/Lucid, 10k from Rivian with a 40k option, and more from other bets.
Nuro is the first real test and now holds a CPUC Drivered Pilot permit to carry passengers with a safety driver. Uber employees have been riding through the Uber app since April, and another shipment of production vehicles are en-route to SF. The next step is a DMV deployment permit and CPUC driverless authority both of which could take 3-6mo.
The Pie Gets Bigger: 10.8M to 17.7M Trips per Day
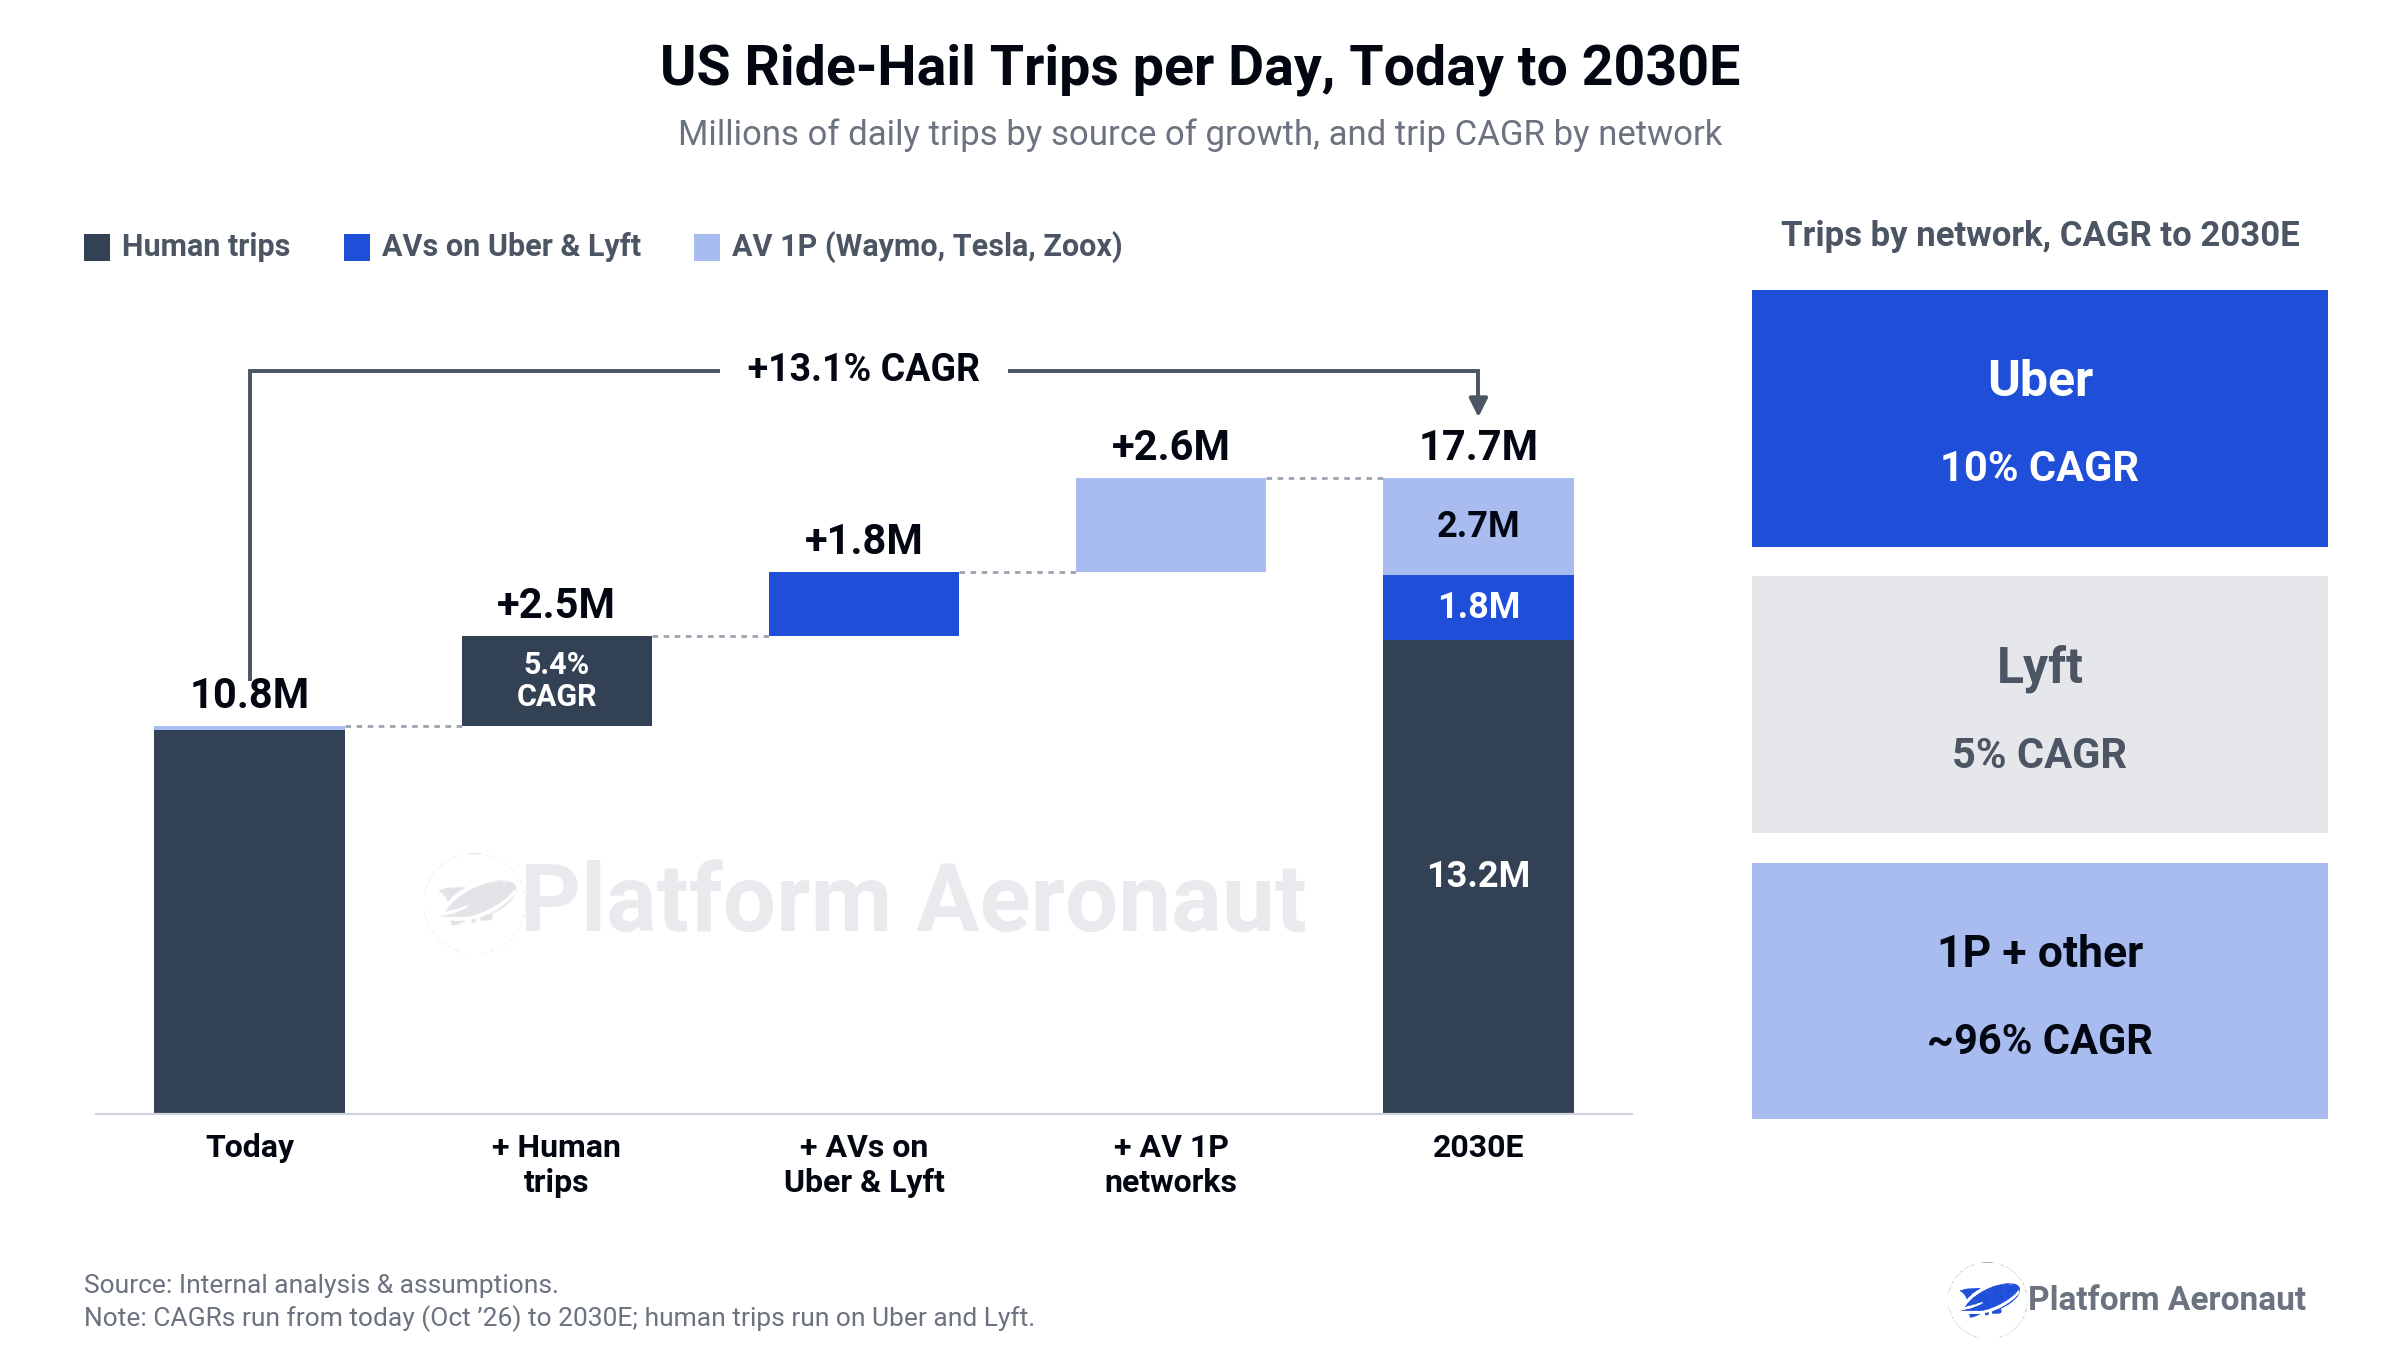
Today I estimate there’s around 10.8m rideshare trips per day of which 10.7m are human-driven. By 2030 if we see a ~13% CAGR on trips we end up with 17.7m trips per day of demand. Adding in the estimated 225k AV fleet across the US with a utilization split of 18-19 trips per day for 1P and 22-23 trips per day for Uber AV trips gets you the incremental trip growth of 4.4m trips per day from AVs.
Human Trips Keep Growing. One objection is that every AV ride is one stolen from human drivers. But early data has shown that the market is growing and expanding enough that even in Waymo 1P cities, Uber mobility trends have either stayed consistent or accelerated. US rideshare is still compounding mid teens and even with the expansion of AV fleets, the category growth is still stronger on a total trip add basis. Baking in the 225k AVs by 2030 you still likely see outsized rideshare demand growth that requires an additional 2.5m trips per day to be served by human drivers or a 5.4% CAGR off today.
Adding all of this up you get to Uber served demand continuing to grow at 10% even with robust growth from Waymo and Tesla. While the aggregators give up % share to 1P networks (99% → 85%), the category compounding at 13% means Uber still grows, and versus Lyft they can further expand category position merely because Uber’s AV fleet will be 7x the size by 2030.
To be clear, trips are necessary but not sufficient. One argument is that it won’t be Uber’s trip count shrinking, but that AV trips carry a lower take rate, Uber has to put up capital to get them, and profit per trip falls even as volume grows. I’ve explored the margin question extensively in the past and you can model it for yourself on my AV Rideshare Run-Rate Economics site.
Why AVs Want to Work for Uber
The bull case is not that Uber unilaterally wins autonomy, it’s that an AV on Uber’s network is a more productive asset than the same AV on a 1P app and fragmented supply will keep choosing Uber.
Here’s the simplest way to demonstrate that:
Unit Economics: One Robotaxi on Two Networks
$20 per ride (approximately US rideshare average today)
1P app at 18 trips/day = $360/day = $131k/year of GBV
Uber app at 22 trips/day = $440/day = $161k/year of GBV
$29k/year of extra bookings on the same $75k vehicle
Breakeven take rate = better for AV owner so long as Uber keeps less than 18% of the fare which is before counting the app, dispatch, and rider acquisition costs the owner no longer has to build.
Reality check on 18% though: Uber’s human mobility take rates run closer to 30% today and at 30% the AV owner nets $308/day on Uber vs $360 on it’s own app. At Waymo’s price premium to UberX today they make even more per day at high utilization and Uber’s breakeven falls as low as 8%. The math doesn’t demonstrate that every AV wants to work for Uber, but it says fleets that can’t afford to build their own demand engine (which is almost everybody beyond Waymo or Tesla) come out ahead on Uber. And in most scenarios it makes sense for Waymo or Tesla to be on Uber anyways.
Why is the Uber car busier? Demand density + a hybrid network. Rideshare demand is materially different day to day and hour to hour and a pure 1P AV fleet has to either under or over provision for peaks and troughs. Uber can size its AV fleet just shy of peak and let human drivers absorb the overflow. I went deeper on this in an earlier post:

So who has the right to win? Here’s how I would map the networks today:
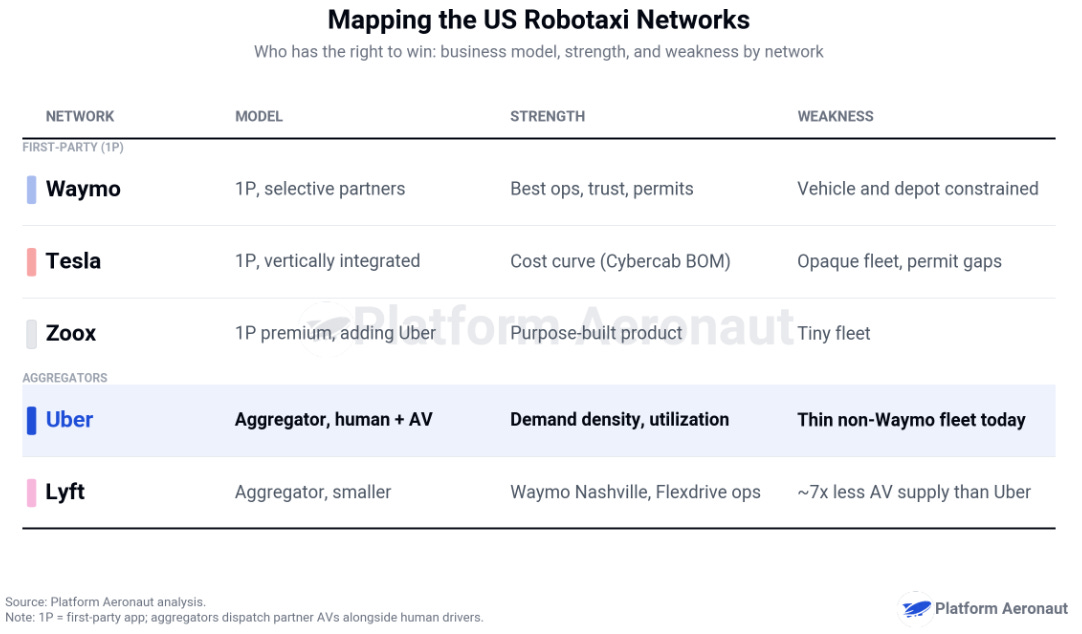
If you believe that there will be multiple AV technology and fleet providers beyond Waymo and Tesla, the best economic decision for those partners is to utilize Uber’s demand engine as opposed to attempting to build out another 1P network. Waymo and Tesla may be able to achieve a vertical 1P network, but is it realistic to envision consumers using 5 or 10 different rideshare apps?
But if AV is so much more productive on Uber, why is Waymo leaving? Waymo’s cars on Uber in Austin and Atlanta are reportedly running 25-30 trips a day which is well above Waymo 1P only cities and they’re still taking it in-house in 2028. I believe this is more of a strategic decision around owning the rider relationship, pricing, and data over what actually maximizes theoretical economic return. That trade only works if you’re the leading operator with $20B of fresh capital and a robust valuation in the private markets. It may be the wrong decision in the long term, but it’s a strategic not an economic decision in the short term.
Challenges to the Thesis:
Human-Trip Assumptions are Wrong: If human trips are actually cannibalized faster than thought then human trips could be closer to flat. Hold them flat at 10.7m trips per day and Uber trip growth is closer to 5% than 10% through 2030.
Cost Curve Beats Utilization: I’ve modeled utilization uplift for an Uber AV at 20%, and Uber has claimed even higher. But if Cybercab class hardware really lands at $25-30k then a 1P fleet running 18-20 trips per day can underprice an Uber dispatched vehicle running 22/day.
Uber Partners Don’t Deliver: If Nuro/Lucid, Rivian, May, Avride, Wayve, VW, and others can’t scale, can’t produce, or can but not in a safe fashion then Uber is in a tough spot.
Take Rates Compress: As AV operators scale they can negotiate and breakeven math is around 18% take rate to Uber. If AV take rates settle well below human take rates then Uber’s trips grow, but revenue per trip declines.
Uber goes asset-heavy: Aviari, depots, and vehicle offtake commitments are a big step away from a pure marketplace model. The market won’t pay the same multiple for a fleet operation business that they will a marketplace. (although at 11x FCF it’s kind of already pricing that).
One Bad Incident: Look back at the first chart and look at when Cruise lost its permit and shut down cutting national fleet in half. A serious crash at any scaled operator will reset the regulatory clock for everybody.
Bottom Line
The “AVs eat Uber” bear case generally assumes a fixed pie with 1P AV operators taking existing share. I modeled out a world with 225k AVs by 2030 going from 1% to 25% trip share with 1P networks owning 64% of the fleet and Uber still compounds trips at 10% a year.
That’s true because of three things:
The category grows faster with AVs than without them.
Humans stay a demand shock absorber that allows Uber to run AV utilization a lot higher.
Every AV provider that isn’t Waymo/Tesla needs demand.
Uber doesn’t need to win the robotaxi race to win the trip math, it needs the pie to keep growing and for there to be successful competitors outside of Waymo and Tesla.
Tickers Mentioned: UBER 0.00%↑ LYFT 0.00%↑ GOOGL 0.00%↑ TSLA 0.00%↑ AMZN 0.00%↑ LCID 0.00%↑ RIVN 0.00%↑ NVDA 0.00%↑ STLA 0.00%↑
The information presented in this newsletter is the opinion of the author and does not reflect the view of any other person or entity, including Altimeter Capital Management, LP (”Altimeter”). The information provided is believed to be from reliable sources but no liability is accepted for any inaccuracies. This is for informational purposes and should not be construed as investment advice or an investment recommendation. Past performance is no guarantee of future performance. Altimeter is an investment adviser registered with the U.S. Securities and Exchange Commission. Registration does not imply a certain level of skill or training. Altimeter and its clients trade in public securities and have made and/or may make investments in or investment decisions relating to the companies referenced herein. The views expressed herein are those of the author and not of Altimeter or its clients, which reserve the right to make investment decisions or engage in trading activity that would be (or could be construed as) consistent and/or inconsistent with the views expressed herein.
This post and the information presented are intended for informational purposes only. The views expressed herein are the author’s alone and do not constitute an offer to sell, or a recommendation to purchase, or a solicitation of an offer to buy, any security, nor a recommendation for any investment product or service. While certain information contained herein has been obtained from sources believed to be reliable, neither the author nor any of his employers or their affiliates have independently verified this information, and its accuracy and completeness cannot be guaranteed. Accordingly, no representation or warranty, express or implied, is made as to, and no reliance should be placed on, the fairness, accuracy, timeliness or completeness of this information. The author and all employers and their affiliated persons assume no liability for this information and no obligation to update the information or analysis contained herein in the future.