

Autonomous Rideshare Economics: Stress-Testing the Model
An interactive model to pressure-test the assumptions behind first-party, third-party, and hybrid autonomous rideshare business models.

Over the past couple of years, autonomous vehicles have crossed an important threshold. This is no longer just a question of if the technology works, but whether the business model work and how it’ll be setup 1P vs 3P, with or without fleet managers, vehicle financing strategies, etc. Waymo is operating real scale in San Francisco and Los Angeles, Tesla continues it’s 10 year history of signaling an imminent robotaxi launch, and Uber has been increasingly explicit that its long-term role may be demand aggregation rather than owning drivers or vehicles. Yet despite the growing volume of commentary, most discussions around autonomous rideshare economics remain hand-wavy. Phrases like “lower cost per mile,” “higher utilization,” or “no driver costs” get thrown around without ever fully connecting the dots.
That gap is what motivated me to build AVRideshareEconomics. I wanted a way to move the conversation from narratives to numbers and force assumptions out into the open and let people stress-test them. If autonomous rideshare really is a multi-hundred-billion-dollar opportunity, the unit economics have to close. This model is an attempt to make that explicit.
What the Website and Model Are
At its core, AV Rideshare Economics is an interactive, bottoms-up unit economics model for autonomous rideshare. It’s designed to let you toggle assumptions and immediately see how they flow through to per-trip economics, contribution margin, EBITDA, and operating profit. Rather than baking in a single “right” view of the world, the site is built around the idea that reasonable people will disagree on inputs and that the only productive way to debate those disagreements is to model them.
The framework supports both first-party (1P) and third-party (3P) operating structures, explicitly separating the economics of the autonomous vehicle provider, the marketplace/aggregator, and the fleet manager where relevant. The goal isn’t to predict winners, but to define the narrow corridors where each model actually works.
Who This Model Is For (and Isn’t)
This model is built for investors, operators, policymakers, and technologists who want to understand when autonomous rideshare works, not to argue that it must. It is not a valuation tool, a demand forecast, or a prediction of winners. It is a framework for pressure-testing assumptions.
Fleet and Utilization: The Real Unlock
If there’s one takeaway embedded throughout the model, it’s that utilization matters more than autonomy itself. Removing a human driver does not automatically make rides cheap. A robotaxi that drives a few hours a day is still an expensive piece of capital sitting idle.
The fleet section forces you to define:
Vehicle purchase cost and useful life
Annual miles per vehicle
Average speed and miles per trip
Daily downtime for charging, cleaning, and maintenance
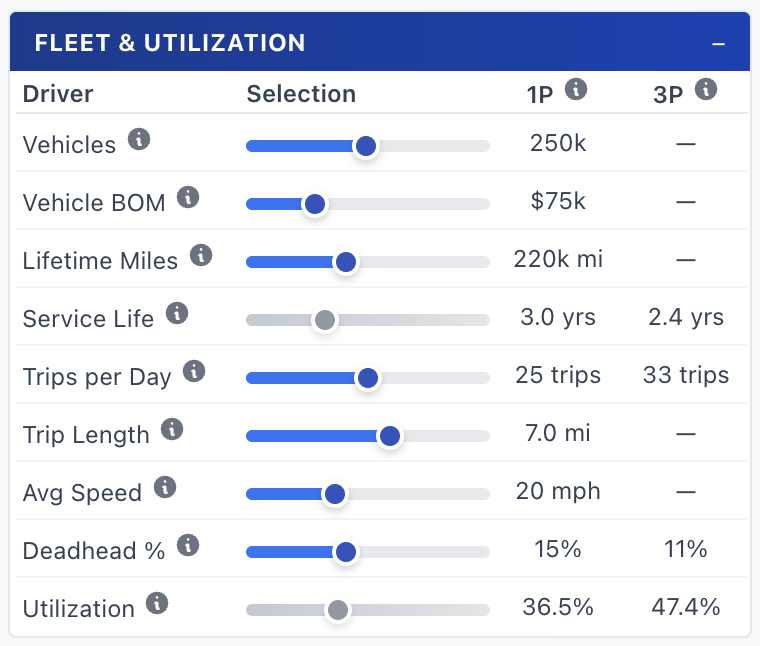
From these inputs, utilization is derived as an output (not something you can hand-wave away). Push utilization higher and capital efficiency improves dramatically, but not without consequences. Higher utilization increases depreciation per day, compresses maintenance cycles, and raises operational complexity. The model makes those tradeoffs visible instead of implicit.
What Usually Breaks First
This is where much of the debate around companies like Waymo and Tesla ultimately converges: not just who has better autonomy, but who can sustainably operate vehicles closer to 24 hours a day without breaking the system. In most scenarios, the economics fail not because of autonomy quality, but because utilization, capital cost, or operational overhead fails to scale as assumed.
Pricing & Marketplace Dynamics
Cost per Mile vs. Cost per Trip
One of the most common mistakes in autonomous rideshare discussions is mixing cost-per-mile logic with cost-per-trip pricing. Riders don’t buy miles; they buy trips. The model explicitly tracks both.
Cost per mile is driven by:
Vehicle depreciation
Energy
Maintenance and cleaning
Insurance and teleoperations
Cost per trip layers in:
Average trip length
Deadhead miles
Marketplace fees and commissions
This distinction matters because short trips can look great on a per-mile basis while still being uneconomic on a per-trip basis once fixed costs are allocated. The model makes it very clear where that breakage happens.
3P Commission and Utilization Efficiency
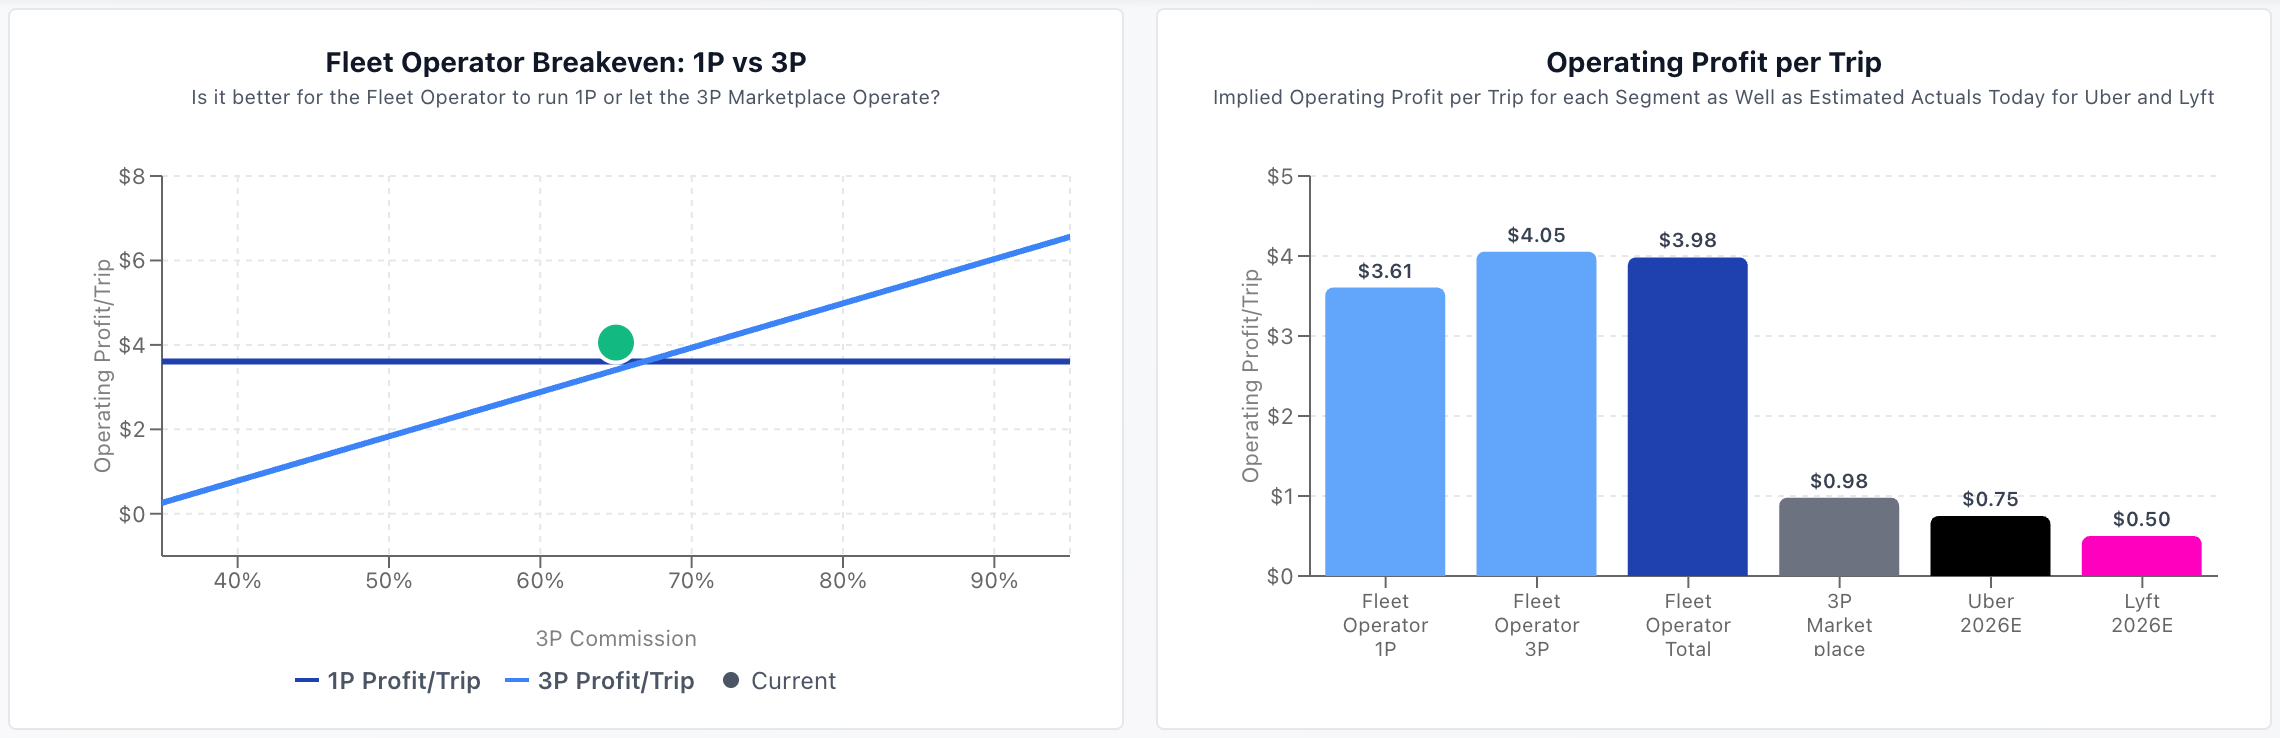
The second pricing lens focuses on third-party marketplace dynamics. In a 3P model, the marketplace takes a commission, which at first glance looks dilutive. But higher utilization enabled by better demand aggregation can more than offset that take rate.
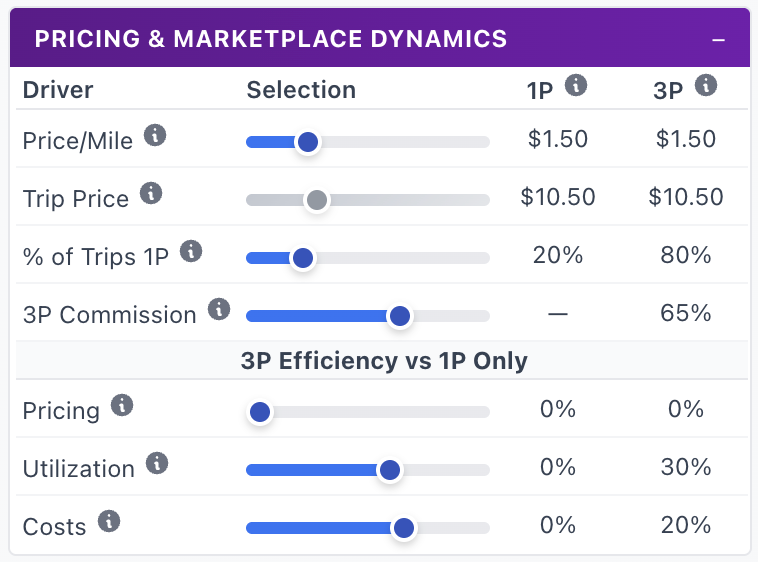
This is the crux of the argument from players like Uber: even if you give up 30–50% of gross bookings as a commission or revenue share to the 1P Fleet Operator, materially higher utilization and faster market expansion can improve absolute dollar economics. The model lets you explicitly test that claim by adjusting utilization uplifts, commission rates, and pricing power side by side.
Early data and disclosures suggest higher effective utilization in Waymo-on-Uber cities relative to Waymo’s 1P-only operations. The big question is how much higher utilization and better unit costs can an aggregator like Uber or Lyft drive than a 1P solution from Waymo or Tesla?
Costs and Cost Allocation
A major design choice in the model is explicit cost allocation. Rather than lumping everything into a single margin line, costs are broken out and allocated based on what actually drives them.
Key cost buckets include:
Energy
Maintenance and repairs
Cleaning
Insurance
Teleoperations
Support
Platform and overhead costs
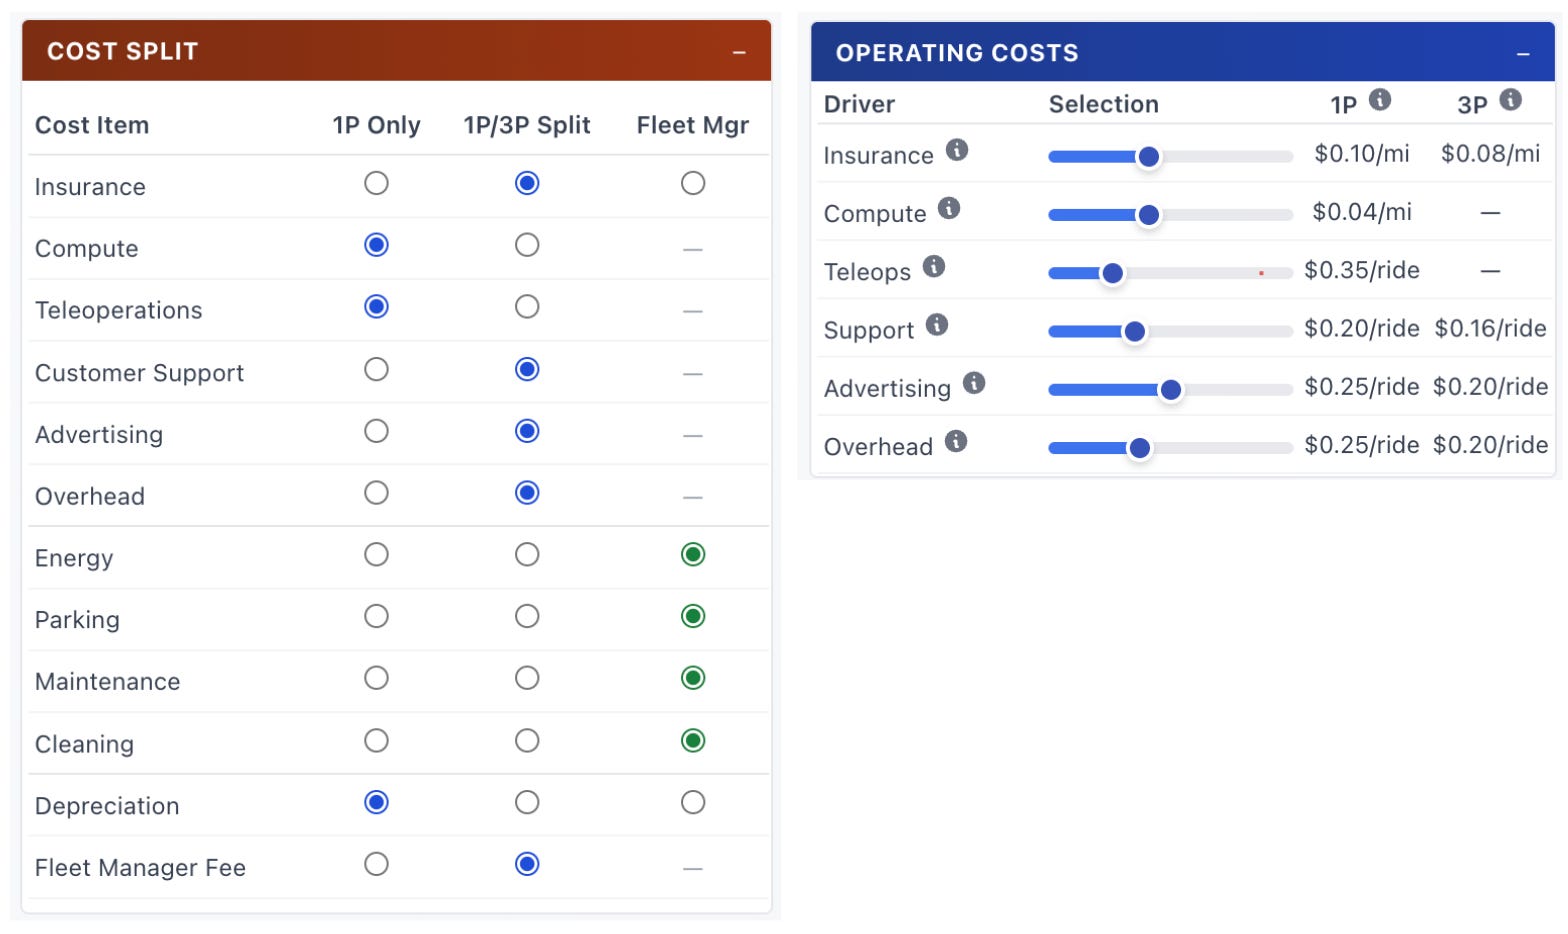
The allocation logic matters. Some costs scale with total system miles, others only with 1P-operated trips, and others are shared across the entire network. The model forces consistency so that per-trip and per-mile metrics reconcile cleanly to the annual P&L or per trip or per mile income statement. This avoids the common mistake of double-counting or under-allocating costs when mixing 1P and 3P operations.
Fleet Manager Economics
An area that’s often ignored in public discourse is the economics of the fleet manager. In many realistic scenarios, the autonomous technology provider will not directly manage charging, cleaning, parking, and maintenance. That role will sit with a fleet manager earning a return on capital and operations.
The model explicitly separates fleet manager revenue and costs, allowing you to see:
Management fee applies to 1P or 3P operator for their services
Cost sliders for those costs under the responsibility of the Fleet Manager
Sensitivity if you click the on/off toggle to remove the fleet manager from the model.
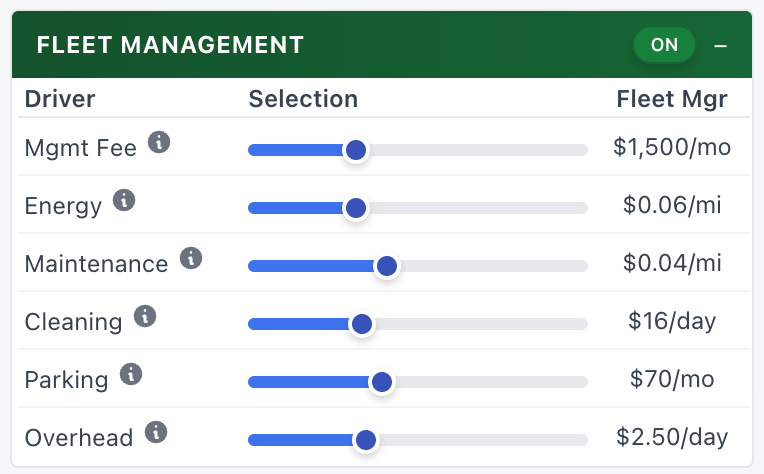
This helps frame an important question: are fleet managers a low-margin utility, or a structurally attractive layer once scale is reached? The answer depends heavily on utilization stability and cost discipline, both of which are easy to assume and hard to achieve.
Vehicle Financing Economics
Finally, the model incorporates vehicle financing, which is often glossed over despite being critical. Autonomous fleets are capital-intensive, and who finances the vehicles (and at what cost) materially changes outcomes.
You can toggle:
Loan-to-value assumptions
Interest rates
Amortization periods
Who bears the financing burden (1P vs fleet manager vs shared)
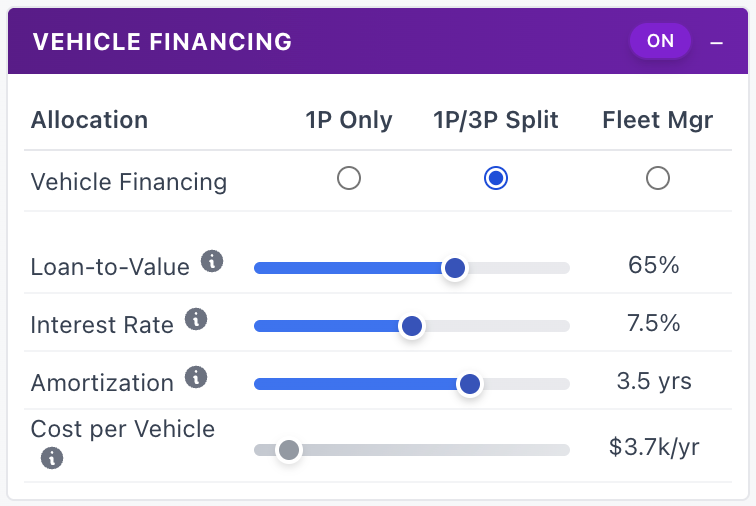
Interest expense flows below EBITDA and Operating Profit by design, reinforcing the distinction between operating leverage and capital structure. This makes it clear when a model “works” operationally but fails once financing reality is layered in. I’m still thinking through how I want to integrate cash flows into this and the capital structure of each player but that’s a future add-on.
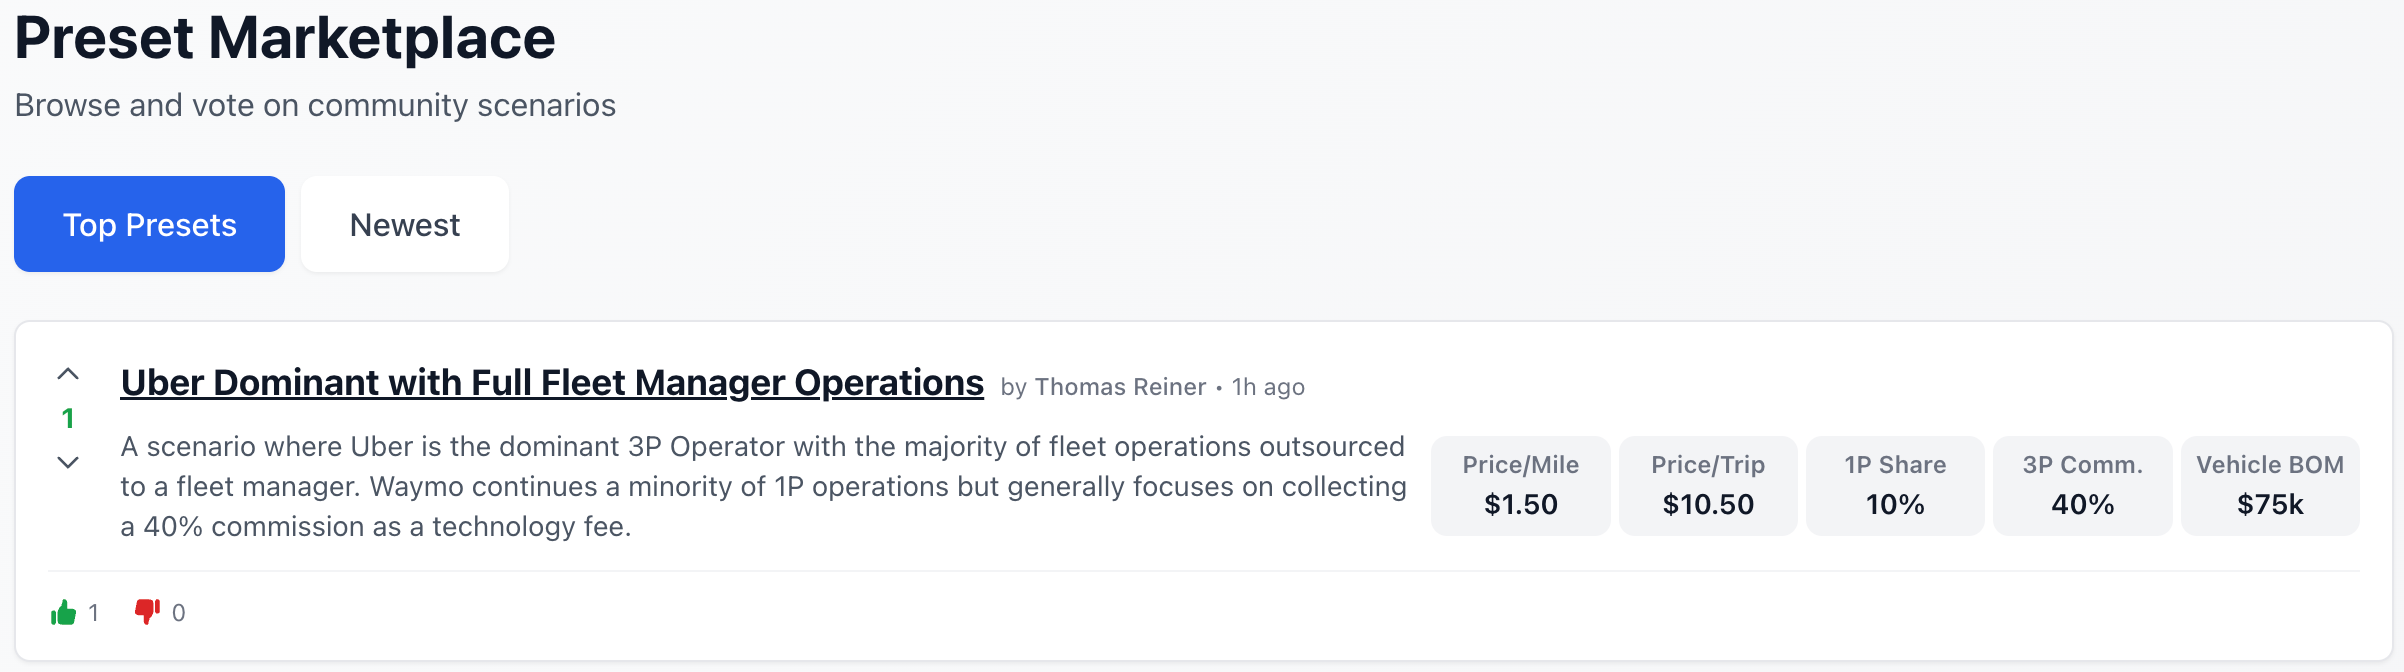
Crowdsourced Presets: Saving and Voting
One feature I’m particularly excited about is the ability to save and share presets. Any user can create a scenario (optimistic, pessimistic, or somewhere in between) and generate a link others can view.
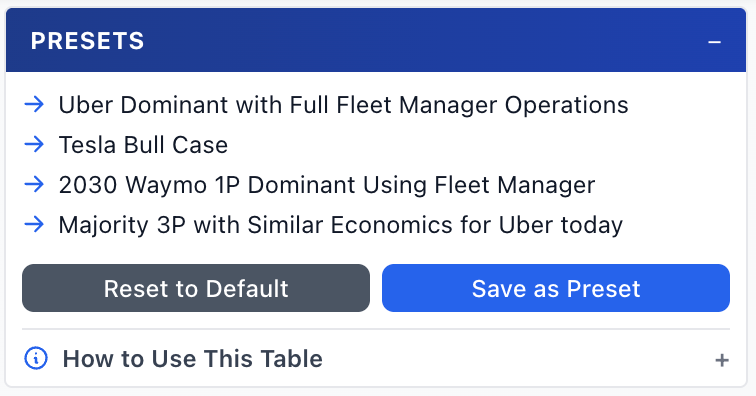
More importantly, presets can be up-voted or down-voted. Over time, this creates a crowdsourced view of which assumptions the community finds most credible. Instead of arguing in threads, the debate happens through models. The highest-voted presets should converge toward something resembling collective wisdom, or at least clearly define where disagreement lives.
A Living Framework
This model definitely is not a finished product. As more real-world data emerges from Waymo, Tesla, Uber, and others, the default assumptions will be updated. Utilization curves, cost structures, and pricing power will all evolve, and the model will evolve with them.
My hope is that this becomes a shared sandbox for thinking rigorously about autonomous rideshare economics. If you think the model is wrong, save a preset and show where the economics break and share it with me. If autonomous rideshare is going to reshape transportation, it will do so because the numbers work. This tool is my attempt to keep that conversation grounded in reality.
The information presented in this newsletter is the opinion of the author and does not reflect the view of any other person or entity, including Altimeter Capital Management, LP (”Altimeter”). The information provided is believed to be from reliable sources but no liability is accepted for any inaccuracies. This is for informational purposes and should not be construed as investment advice or an investment recommendation. Past performance is no guarantee of future performance. Altimeter is an investment adviser registered with the U.S. Securities and Exchange Commission. Registration does not imply a certain level of skill or training. Altimeter and its clients trade in public securities and have made and/or may make investments in or investment decisions relating to the companies referenced herein. The views expressed herein are those of the author and not of Altimeter or its clients, which reserve the right to make investment decisions or engage in trading activity that would be (or could be construed as) consistent and/or inconsistent with the views expressed herein.
This post and the information presented are intended for informational purposes only. The views expressed herein are the author’s alone and do not constitute an offer to sell, or a recommendation to purchase, or a solicitation of an offer to buy, any security, nor a recommendation for any investment product or service. While certain information contained herein has been obtained from sources believed to be reliable, neither the author nor any of his employers or their affiliates have independently verified this information, and its accuracy and completeness cannot be guaranteed. Accordingly, no representation or warranty, express or implied, is made as to, and no reliance should be placed on, the fairness, accuracy, timeliness or completeness of this information. The author and all employers and their affiliated persons assume no liability for this information and no obligation to update the information or analysis contained herein in the future.