


On August 20, Nevada regulators approved roughly 7,100 robotaxis for Clark County in a single meeting: 5,000 for Tesla, 1,000 each for Waymo and Uber’s new Aviari subsidiary, on top of Zoox’s existing 100. The largest state fleet approval ever.
Here’s the thing that made me want to write this post: the entire active US commercial robotaxi fleet is about 4,000 vehicles (approx ~3,800 Waymo, ~60 Tesla, 35 Zoox). Nevada just approved nearly double the national fleet for one county. The permits and the pavement have never been further apart.
And into that gap, four very different companies are pouring capital with four very different theories of what wins. On Uber’s Q2 call Dara said: AVs are “physical AI,” and the industry will look like the foundation model ecosystem with many stacks, no single winner, and the commercialization layer capturing the value. Waymo’s behavior says the opposite (own the rider, own the data, own the whole thing). Tesla’s behavior says something different again (own the cost curve, everything else follows). This kind of spurred me to do a review of who’s playing what game, with a 12 month scorecard of falsifiable milestones at the end.
As always, some of these numbers are swags with a lot of assumptions, let me know your thoughts and where I may have made any mistakes.

The Framework: Wide vs. Deep
Every robotaxi strategy is a point on two axes: how many markets you’re in (breadth) and how much supply you put into each one (depth). Plot the four players and the strategies stop looking like variations on a theme and start looking like entirely different businesses.
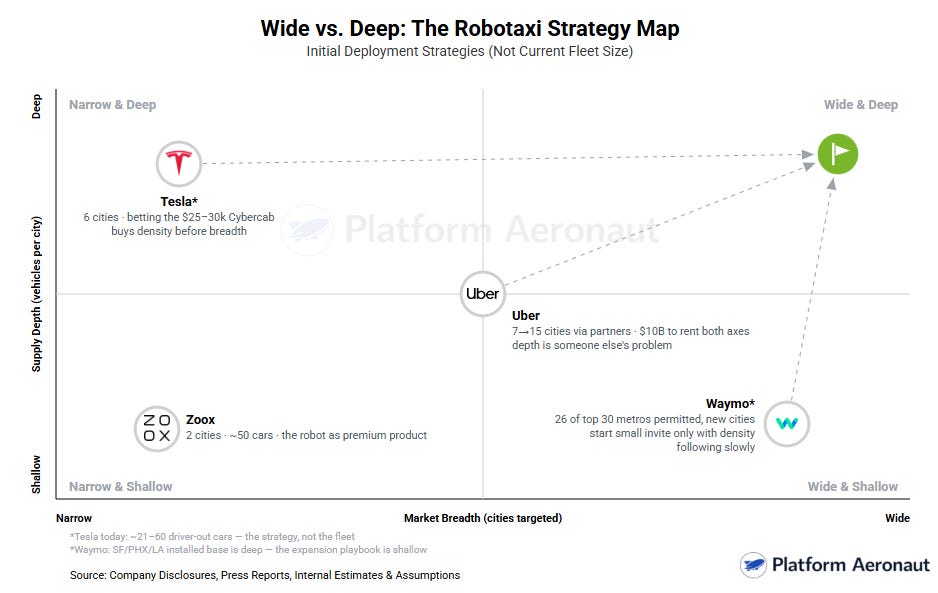
To be clear, these aren't maturity stages of the same strategy. They're bets on where the moat forms: trust and permits (Waymo), manufacturing cost (Tesla), demand aggregation (Uber), or product experience (Zoox). Only one layer of the stack gets to keep the margin. Let's go through them.
Waymo: Wide and Shallow, By Design
Waymo closed a $16B round at $126B post-money in February led by Alphabet, Dragoneer, DST, and Sequoia that valued the business at more than 2x the October 2024 $45B round.
The growth curve is the best single chart in the space:
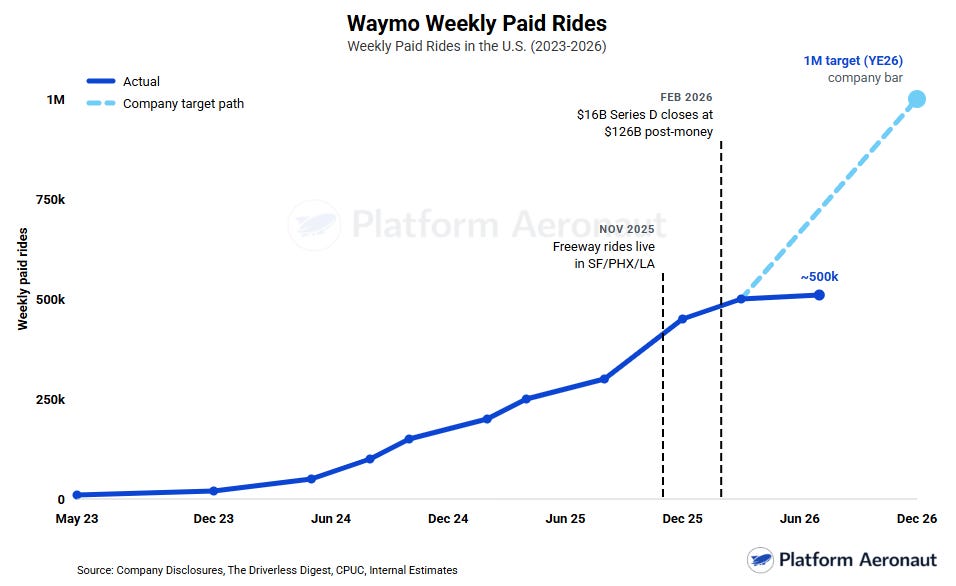
Waymo is doing ~500,000 paid rides a week today with 20M+ lifetime trips and 14M in 2025 alone (>3x 2024). The CPUC just expanded Waymo’s permitted California footprint ~10x to 47,493 square miles, it’s permitted or testing in 26 of the top 30 US metros, and ten new 2026 cities are named plus London. But look at how it lands: San Diego opens publicly at ~40 square miles against that 10x permit, and everything is invitation gated. Waymo plants a flag in every metro and lets the fleet fill in behind the permits over years. Wide and shallow, deliberately.
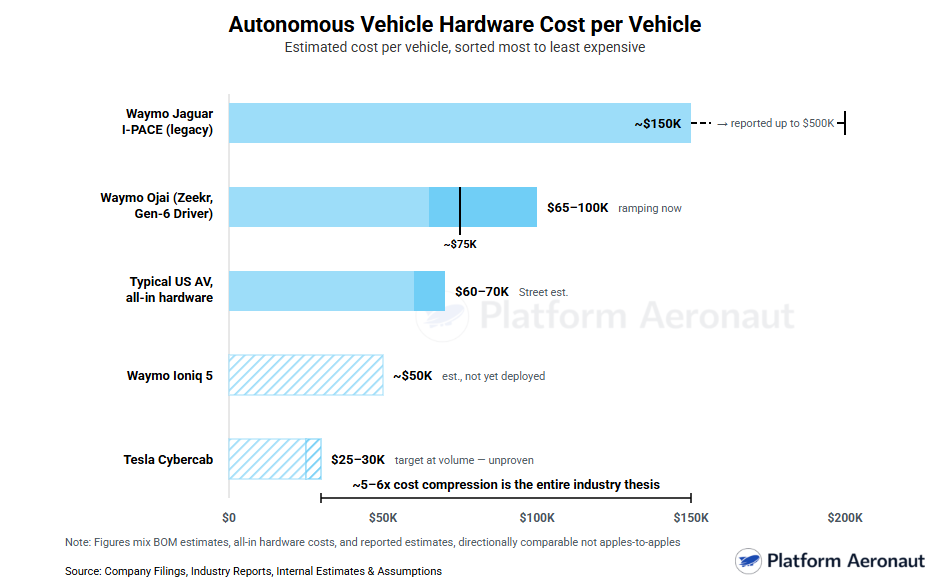
Why? Because the constraint was never capital ($27B+ raised since 2020), it’s vehicles and depots. The legacy Jaguar I-PACE reportedly ran anywhere from $175k to $500k all-in per vehicle (which would never work), with operating costs estimated at $2–6 per mile. The fix is twofold. On hardware: the Zeekr built Ojai at roughly $75k (a ~$50k Ioniq 5 variant behind it), now open to all riders in LA, Phoenix, and SF and ramping toward 5,000+ vehicles by year-end. On operations: Waymo is quietly becoming an AV technology provider that outsources the physical layer city by city (Moove/AVOMO, Avis, Lyft’s Flexdrive, Transdev) pushing the depot problem onto partners’ balance sheets. It’s an asset light expansion for a historically asset heavy company.
Now the math the $126B has to answer for: Average revenue per ride runs ~$20 so even at 1M weekly rides, that’s a ~$1.04B run rate, meaning the round paid ~121x run-rate revenue. Meanwhile, inside Alphabet’s ~$4T SOTP Waymo rounds to ~3%, and Pichai says it won’t be financially meaningful until 2027–28 (and no, no spinoff). The private mark is rich; the public market pays roughly nothing. Both can’t be right forever. One yellow flag on the path there: California paid ride growth decelerated to +89% Y/Y in Q2 which is still impressive, but it means the 1M target rides on new cities working, not old ones compounding.
And the soap opera: the Waymo–Uber Phoenix partnership wound down this summer, and Waymo plans to end Austin/Atlanta exclusivity in January 2028 and go solo despite reports that Waymo vehicles on Uber’s app achieve higher per vehicle utilization (25–30 trips/day) than Waymo’s own first party service. Walking away from the partner that makes your assets sweat hardest, because you believe the rider relationship is the prize, is the purest expression of the vertical integration thesis you’ll find.
Tesla: Narrow and Deep (Except It Isn’t Deep Yet)
Tesla’s robotaxi Q2 is a Rorschach test, and frankly the ambiguity is itself the story. Cumulative paid miles reached ~2.4–2.5M through Q2. Monthly pace fell from ~500k in April to ~200k in May and June. TechCrunch read the same disclosure as 1.1M Q1 → 700k Q2, a −36% decline (and MLQ interprets it as -18%) while bulls touted +41% cumulative. When a company only publishes the cumulative curve, the second derivative is the story, and the second derivative went negative.
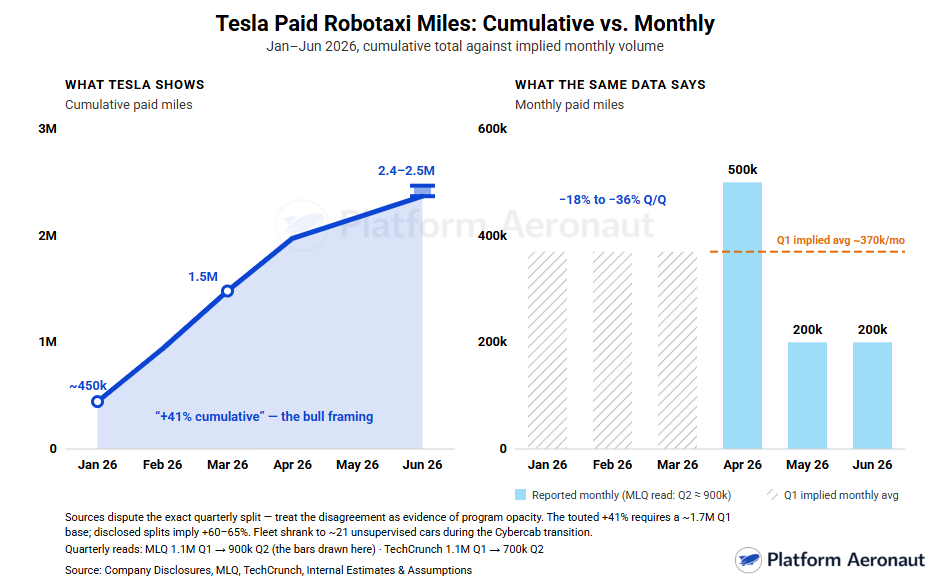
Tesla’s explanation does appear reasonable though: the active unsupervised fleet reportedly shrank to ~21 cars during the Cybercab transition. Various banks and trackers have shown anywhere from 60 to 104 Tesla vehicles operating and the fact that reasonable people can’t agree on the fleet size within a factor of five tells you how opaque this program is, and I’m treating the spread as evidence rather than resolving it. There are reports that Tesla is intentionally holding Model Y additions back, betting everything on the purpose built vehicle. And Musk himself retired the decade old fleet-data thesis by admitting Tesla must “accumulate driving data specific to the Cybercab” before scaling. The Cybercabs are being retrofitted with steering wheels and pedals for calibration. Ten million customer cars, it turns out, did not pre-train the two seater.
So why does anyone care? Because the Cybercab math, if it lands, is a different sport. Pilot production began in February at Giga Texas; the Q2 release cites >125,000 units of installed annual capacity; the official launch event is September 3 in Austin. Analysts forecast Tesla’s long-term BOM at $25–30k against $65–100k for Waymo’s Gen-6 and $60–70k all-in for typical US AV hardware. If those numbers hold at scale, the cost curve is the moat and everyone else is renting time.
But there’s negatives too: 22 crashes reported to NHTSA of varying severity in year one, including 3 caused by teleoperators remotely moving vehicles, set against the company’s claim of 380k+ unsupervised miles with zero notable incidents. The Q2 deck dropped “2026 mass production” language for the Cybercab, the affordable model, and Optimus; the stock fell 12–13% on the print; Q2 FCF was −$1.1B even as deliveries hit a record 480,126. The car business is funding the AV bet.
The Vegas whiplash captures it all in one week: July 27, Tesla capped at 10 vehicles, 45 mph, banned from the airport. August 20, a ceiling of 5,000 and the airport ban lifted. Tesla’s Cybercab chief engineer: “The 5,000 has always been a ceiling,” adding he’d be “extremely happy” with 2,500 in year one. The permits now vastly exceed the fleet and Nevada’s 120-day commercial service clock (mid-December deadline) will test whether that gap closes or the permit lapses.
Put simply: Tesla’s strategy is the only one that gets cheaper per unit as it grows and it’s the only one currently shrinking.
Uber: The Launch Cadence Machine
Remember that Uber’s AV story sits on top of a business that is printing: Q2 gross bookings +22% to $58B+, and TTM free cash flow above $10B for the first time. Consensus has FY26 at $57.9B revenue, $11.4B adjusted EBITDA (19.7% margin, walking to ~22% by 2029), and $10.4B FCF (roughly 15.6x forward FCF for a business deciding how much of that FCF to spend defending its own terminal value.)
The answer is $10B, multiyear, three pronged strategy: vehicle offtake commitments to help partners scale, milestone-based equity in the software layer (Uber claims each dollar it puts in pulls ~$2.50 of outside capital alongside), and direct capex for depots, charging, and real estate. Targets: 7 AV cities today → 15 by YE26 → 28 by 2028, with ~120,000 vehicles committed to the network by partners.
And besides, the cadence really is a machine. The evidence list just from recent months:
Apr ‘26: Nuro/Lucid deal expanded to ≥35,000 vehicles including Lucid’s midsize platform
Jun ‘26: WeRide joint pilots launch in Madrid and Zurich
Aug 5: Q2 call — Wayve London (100k+ rider signups, TfL licenses), Wayve Tokyo, Baidu London, Pony + Verne Zagreb, NVIDIA backed LA & SF for 2027
Aug 14: Pony.ai deal expanded to 2,000+ Level 4 robotaxis across five European cities
Aug 20: Baidu’s fully driverless Apollo Go launches on Uber in Dubai — billed as the first multi-partner autonomous network globally
Aug 20: Nevada permit granted through Uber subsidiary “Aviari Services,” operating Zoox and Motional hardware
Later this year: Nuro/Lucid Bay Area launch (the first Uber owned fleet, driver out US offering)
Mid 2027: Houston becomes Nuro/Lucid market #2, with a 50,000 sq ft Uber depot already secured
Two of those matter more than the rest. Aviari means Uber now owns a fleet operations entity: a real step down from pure asset-lightness, and an admission that someone has to run the depots. And AV Labs (collecting high-fidelity rideshare data to train partner models, co-developing Cosmos based data infrastructure with NVIDIA) means Uber is moving up the stack. Dara’s favorite proof point for driver commoditization is NVIDIA’s open weight Alpamayo AV model. Think of this as Uber spending $10B to make its own thesis come true: if the driver is a commodity, the demand layer wins.
But does the thesis survive contact with the Waymo breakup? Here’s the bear math: strip Waymo off the app in Phoenix, Austin, and Atlanta, and Uber has fewer than 200 non-Waymo autonomous vehicles taking paid rides in the US, across two cities. No partner besides Waymo has scaled past 100 cars on-app. AVs are still <0.5% of total Uber trips. This all makes the Nuro/Lucid Bay Area launch the single most important date on Uber’s calendar.
Uber’s counter evidence is worth taking seriously though: in the markets where robotaxis are most available off platform (Phoenix, LA, SF), Uber’s mobility trends accelerated in Q2. And the structural argument for the hybrid network keeps showing up: rideshare demand swings second-by-second, so a pure AV fleet must either over-provision for the peak (killing utilization) or fail it (killing reliability). Human drivers are the shock absorber.
If the market converges to one vertically integrated winner, the aggregator is the one who gets commoditized. Uber wins if anyone other than Waymo scales whether it’s Nuro, Wayve, Pony, Baidu, or Zoox. Waymo has to win alone. I'll take the field.
Zoox and Lyft: The Premium Experiment and the Understudy
Zoox began charging on August 10 in Las Vegas as the first controls free robotaxi in the US to take fares, enabled by NHTSA’s first ever exemption in July. And the launch-day pricing stat is the most interesting data point: Zoox averaged $22.62 versus Lyft’s $14.44 across six Strip routes (a 57% premium).
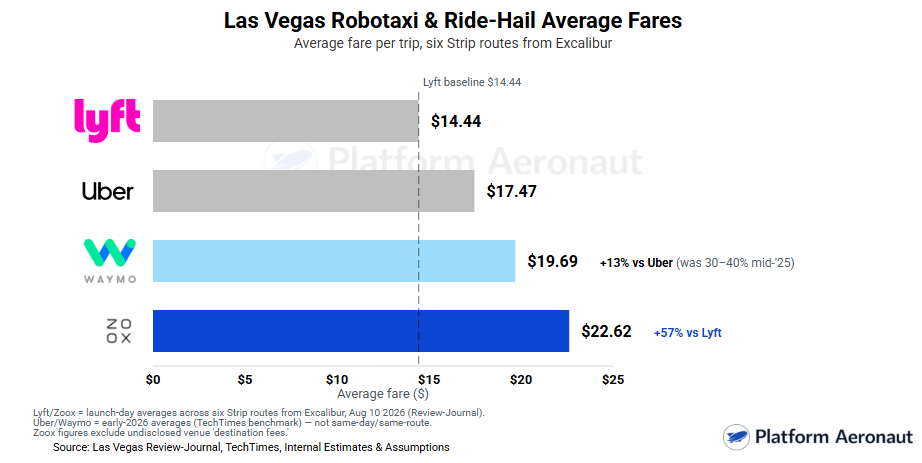
For context, Waymo’s premium over Uber has narrowed from 30–40% in mid 2025 to ~13% now. Zoox is running the opposite play: the robot itself as a premium product. Purpose-built bidirectional vehicle, social cabin, ~50 vehicles total across Vegas + SF. It’s tiny, but Zoox controls its own supply chain at a Fremont facility capable of 10,000+ vehicles a year, an Uber-app integration is planned later this year, and a $40M Hesai LiDAR order from an unnamed “leading US robotaxi company” is the supply-chain breadcrumb. CEO Aicha Evans has the most honest quote in the industry: “there’s a new hard that’s coming, which is paid operations.” She said that shortly after a Zoox drove into a Vegas fire scene and prompted a fleet recall.
Lyft, meanwhile, is quietly assembling a real AV story out of being Waymo’s understudy. Nashville joint ops began in June on Lyft’s Flexdrive infrastructure, the October depot opening is the buyside’s proof point, Baidu testing has started in London (RT6 vehicles, commercial target 2027), and there’s a Tensor Hyperion reference architecture deal behind it. Two data points complicate the Lyft-as-roadkill take: SF ride volume within Waymo’s operating footprint grew ~20% Y/Y which was Lyft’s strongest growth in any market, and management argues AV availability pulls new customers into the category entirely. The worry is that Lyft gets forced into capital intensive fleet ownership to keep its seat. But at that multiple, the short is less clean than the narrative.
The 12 Month Scorecard
Frankly, the best thing about this moment is that everyone has published their own bar. Each of these is falsifiable by August 2027:
Waymo: 1M weekly rides by YE26, London live in 2026, Ojai fleet past 5,000 vehicles
Uber: 15 AV cities by YE26; Nuro/Lucid Bay Area actually launches “later this year” with a driver-out US offering.
Tesla: a meaningful share of the 5,000 car Vegas ceiling on the road (self-set bar: 2,500 = “extremely happy”), and monthly paid miles re-accelerating off the ~200k May–June run rate
Zoox: hold the +57% premium at real utilization, and ship the Uber app integration
Lyft: Nashville live to the public, October depot on time, plus any second Waymo market
Everyone (Vegas): commercial service inside the 120-day NTA window (mid-December), or the permit lapses
Second order tells I’m logging now: whether any non-Waymo partner crosses 100 cars on Uber’s app; whether Waymo’s California growth re-accelerates as new cities open; and whether Gridwise’s displacement gap (drivers in robotaxi cities completed 5.3% fewer trips/hour in 4Q25 Y/Y vs −2.6% nationwide and the first hard displacement print) widens.
The Bottom Line
Wide-and-shallow bets on trust and permits. Narrow-and-deep bets on the cost curve. The cadence machine bets on fragmentation itself. The premium experiment bets the robot is the product. 60-65M annualized paid robotaxi rides is 0.3% of global rideshare and even against just the 5B US Uber & Lyft rides it’s barely 1% which makes it a rounding error with a $126B price tag. But every one of these companies has now published its own bar, and Nevada started a 120-day clock. By this time next year, we won’t be arguing about strategy decks, we’ll be counting cars and market impact.
The information presented in this newsletter is the opinion of the author and does not reflect the view of any other person or entity, including Altimeter Capital Management, LP (”Altimeter”). The information provided is believed to be from reliable sources but no liability is accepted for any inaccuracies. This is for informational purposes and should not be construed as investment advice or an investment recommendation. Past performance is no guarantee of future performance. Altimeter is an investment adviser registered with the U.S. Securities and Exchange Commission. Registration does not imply a certain level of skill or training. Altimeter and its clients trade in public securities and have made and/or may make investments in or investment decisions relating to the companies referenced herein. The views expressed herein are those of the author and not of Altimeter or its clients, which reserve the right to make investment decisions or engage in trading activity that would be (or could be construed as) consistent and/or inconsistent with the views expressed herein.
This post and the information presented are intended for informational purposes only. The views expressed herein are the author’s alone and do not constitute an offer to sell, or a recommendation to purchase, or a solicitation of an offer to buy, any security, nor a recommendation for any investment product or service. While certain information contained herein has been obtained from sources believed to be reliable, neither the author nor any of his employers or their affiliates have independently verified this information, and its accuracy and completeness cannot be guaranteed. Accordingly, no representation or warranty, express or implied, is made as to, and no reliance should be placed on, the fairness, accuracy, timeliness or completeness of this information. The author and all employers and their affiliated persons assume no liability for this information and no obligation to update the information or analysis contained herein in the future.
Great analysis as always and cool way to think about each company's approach.
Just to be clear on Uber though, they have 0 AV partners doing autonomous rides in the United States :)
"But does the thesis survive contact with the Waymo breakup? Here’s the bear math: strip Waymo off the app in Phoenix, Austin, and Atlanta, and Uber has fewer than 200 non-Waymo autonomous vehicles taking paid rides in the US, across two cities. No partner besides Waymo has scaled past 100 cars on-app. AVs are still <0.5% of total Uber trips. This all makes the Nuro/Lucid Bay Area launch the single most important date on Uber’s calendar."
First time reader. This was thoughtful and provocative. The only of these approaches I feel qualified to share a take on is Uber. The rest are still evolving. Uber is Deadman walking. The US offerings that have or may scale don't need Uber. The Chinese players working with Uber just need a short-term talisman for market entry. Anyone seeing what has happened with the modest let's see what happens with Uber and Waymo has seen Phoenix go away with Austin/Atlanta at the two minute warning. Waymo (or anyone else that is credible) will only be interested in partners who add value. The best test of that will be Lyft in Nashville who is committed to providing value for Waymo in their lowest population density city they have ever bothered to explore. This could evolve into something sensible and allow right-sizing of the peak demand fleet size.
Follow the space closely. There are no fleet limits for Waymo in their service areas. This is silly grandstanding and merely says someday when I grow up to be a boy I wish for 1000 cars or 5000 cars. Nothing more. Clark County is an unusual taxi culture and manages even light licensing with vehicle counts. The best metric for autonomous taxis is to gauge equivalent 24by7 fleet vehicles which has nothing to do with how many are in the parking lot or in a dreamer's head. It is the number that can be simultaneously operated by the provider (can be remotely managed at scale safely and insurable). The number is hard to estimate for the players with no credible scaled markets just yet. The big players (Waymo & Chinese triumvirate) all provide adequate public data to accurately estimate this. The rest are hedging as you might expect. Here's a simple observation. Waymo did about 160K miles/day in SF way back in Q1. That means at least 800 concurrent cars or so. Zoox does closer to 5000 mi/day in Vegas & Bay combined. Tesla does about 2000 mi/day in Austin. Those are both Q2 numbers. It is charming to say I want 1000 cars in Vegas for Zoox. That's 5 miles/day/car. The Tesla grift even more ridiculous 0.4 miles/day per wishful car. You can push them that far. It is entirely too early to pretend to surmise what each of these companies want. Most of them don't know themselves yet.
I'll end with your final statement of "Waymo wants every city. Tesla wants the cost curve. Uber wants everyone else's AVs. Zoox wants a premium. Someone's wrong." -- Waymo is scaling to cities that offer affluence, high pop density and tourism. Tesla wants a merger story. Uber wants to run out the clock and create uncertainty. Zoox (Amazon) wants the last mile.