Tech Dilution Through Q3: Discipline Cracks at Big Tech
Why Meta, Tesla, and others Are backsliding while smaller caps stabilize. The AI supercycle is exposing who has real SBC discipline and who’s losing the plot.
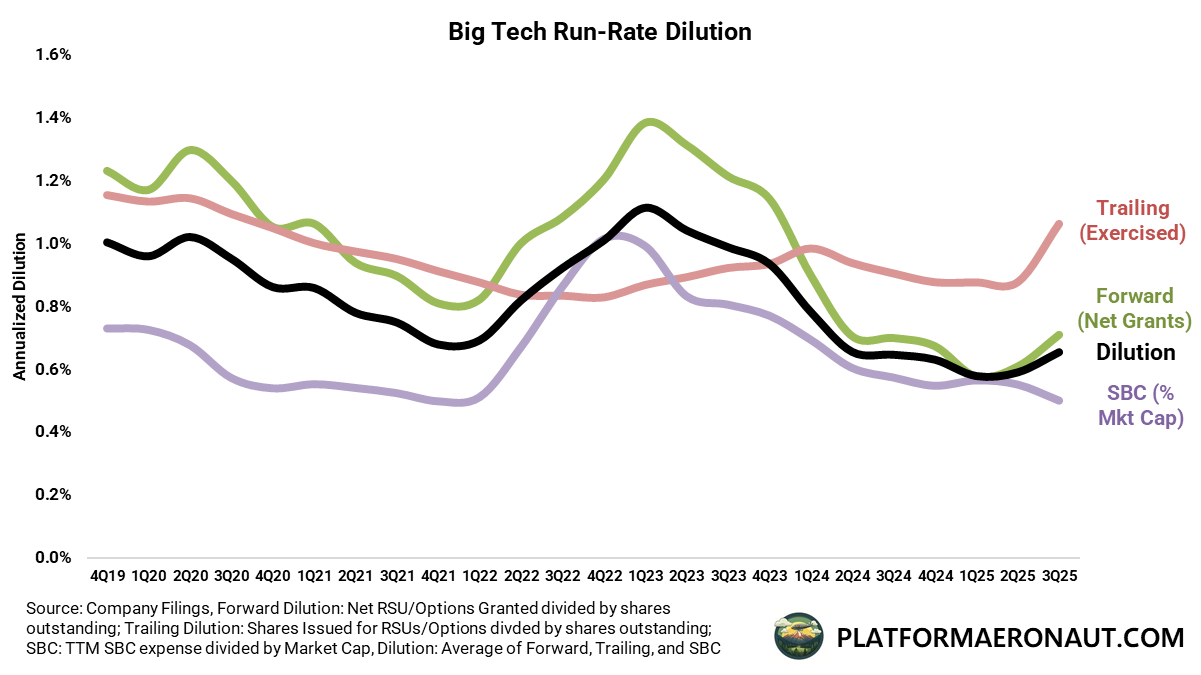
Dilution among public tech companies has seen some bifurcation. The large cap tech companies have started to see increased dilution, some of this is timing related, some of this is incremental grants from the mega caps like Meta for AI engineers. Either way some of the discipline we’ve seen has started to dissipate as we’ve moved deeper into the AI supercycle:
Looking at Big Tech dilution specifically, we have three main components driving how I calculate dilution:
Trailing Dilution: Shares issued for RSUs/Options divided by shares outstanding
This is essentially backwards looking for past grants, given stock comp tends to vest over 4 years it’s a moving average of past decisions.
Forward Dilution: Net grants of RSUs/Options (granted minus cancelled) divded by shares outstanding
This is decisions made today on grants and RIFs and cancellations that will impact future dilution. When management teams say things like “Our dilution run rate is <2.5%” it often refers to this.
SBC Dilution: Stock-based compensation expenses divided by market cap
My least favorite method because it utilizes valuation and SBC expense itself isn’t a perfect metric, but it’s a good gut check.
Looking at Big Tech specifically I want to call out a few things:
Trailing dilution is jumping because of Tesla’s CEO award for Elon. This isn’t the mega package, but rather 96m shares issued to Elon in the short term:
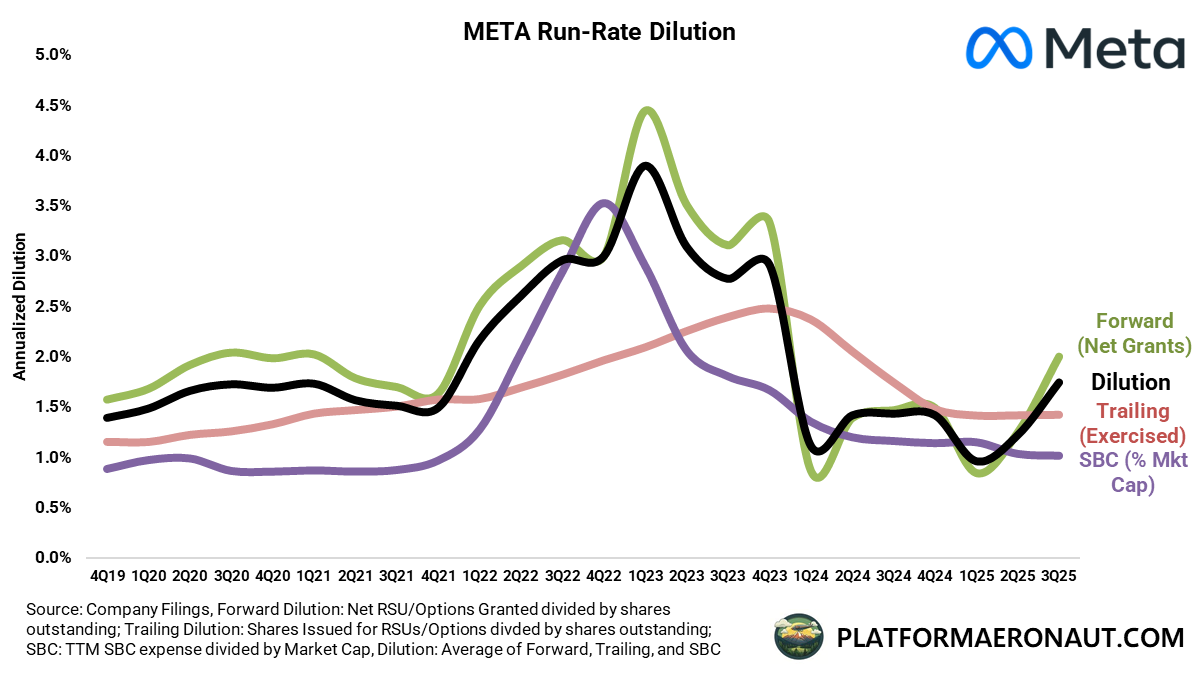
Forward dilution is jumping up because of Meta specifically. YTD 2025 through Q3 Meta has issued 49m RSUs net of cancellations versus 38m net issued for all of FY2024. AI engineers are expensive.
SBC dilution is coming down mostly because of stock market price expansion. If the market pulled back 10% this would shoot right back up because SBC dilution is a combination of trailing SBC expense and current market cap. It’s not my favorite metric but it’s decent as a subcomponent of my total dilution metric.
My favorite chart to try to separate and see outliers and outperformers on dilution is this updated chart on tech company dilution versus market capitalization:
Naturally smaller companies in technology are seeing higher dilution. That can be for a few reasons:
Post growth laggards like TRIP, BOX, BILL and GTM
Hypergrowth at any cost without a focus on dilution like SNOW and MDB
Generally worse business models than the Mag 7 with a higher employee count requirement like W, PINS or LYFT.
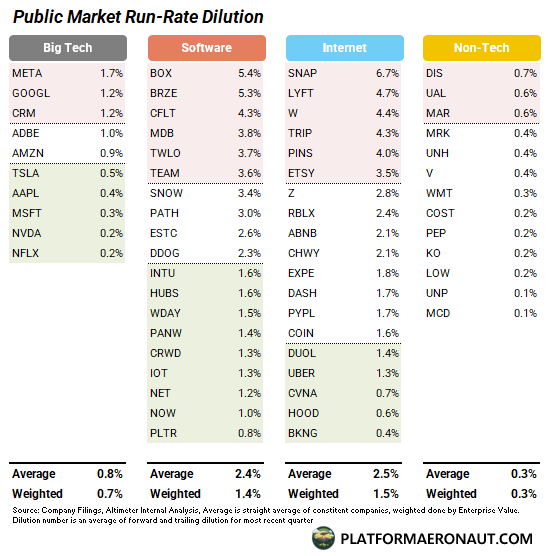
So the above chart and analysis is a more fair way to cohort companies based on dilution versus the market capitalization/size. Just note when you look at the mega caps like META how much more they’re diluting than NVDA, MSFT, and AAPL.
Cohort Leaders and Laggards
Here is a non-exhaustive list of some of the cohorts and individual companies charted out in some of the above graphs. I’ve highlighted in red those companies that are notably diluting higher than their peer set.
Tech Company Dilution Leaderboard
You can find the leaderboard from 1Q25 in a previous post. The most notable change at the top are that NFLX has taken over the top spot from BKNG.
Generally the way to read this is that names in the top couple groups are doing pretty good all else being equal. Those in the bottom half are doing pretty poorly. The numbers are where they rank in total and I’ve highlighted the top and bottom decile for each category.
Notable Y/Y Changes in Leaderboard
Since 3Q24 we’ve seen some drastic changes in the dilution leaderboard. HOOD has skyrocketed to 4th place from the middle of the pack while META has plummeted from middle of the pack to one of the worst across all of tech.
Tickers Mentioned: SNOW 0.00%↑ UBER 0.00%↑ NOW 0.00%↑ META 0.00%↑ HOOD 0.00%↑ EXPE 0.00%↑ BKNG 0.00%↑ MSFT 0.00%↑ CRM 0.00%↑ DASH 0.00%↑ CRWD 0.00%↑ BOX 0.00%↑ LYFT 0.00%↑ TWLO 0.00%↑ TSLA 0.00%↑ PAYC 0.00%↑ NFLX 0.00%↑
The information presented in this newsletter is the opinion of the author and does not necessarily reflect the view of any other person or entity, including Altimeter Capital Management, LP ("Altimeter"). The information provided is believed to be from reliable sources but no liability is accepted for any inaccuracies. This is for information purposes and should not be construed as an investment recommendation. Past performance is no guarantee of future performance. Altimeter is an investment adviser registered with the U.S. Securities and Exchange Commission. Registration does not imply a certain level of skill or training.
This post and the information presented are intended for informational purposes only. The views expressed herein are the author’s alone and do not constitute an offer to sell, or a recommendation to purchase, or a solicitation of an offer to buy, any security, nor a recommendation for any investment product or service. While certain information contained herein has been obtained from sources believed to be reliable, neither the author nor any of his employers or their affiliates have independently verified this information, and its accuracy and completeness cannot be guaranteed. Accordingly, no representation or warranty, express or implied, is made as to, and no reliance should be placed on, the fairness, accuracy, timeliness or completeness of this information. The author and all employers and their affiliated persons assume no liability for this information and no obligation to update the information or analysis contained herein in the future.


Love this!
Awesome analysis. Any chance you could add MNDY and GTLB?