


When I launched this online version of my dilution tracker in March things were looking up. We had seen 1.5 years of declining dilution and although there were some outliers, generally companies were taking their medicine. Since then we’ve seen 4 straight quarters of increasing dilution across the board:
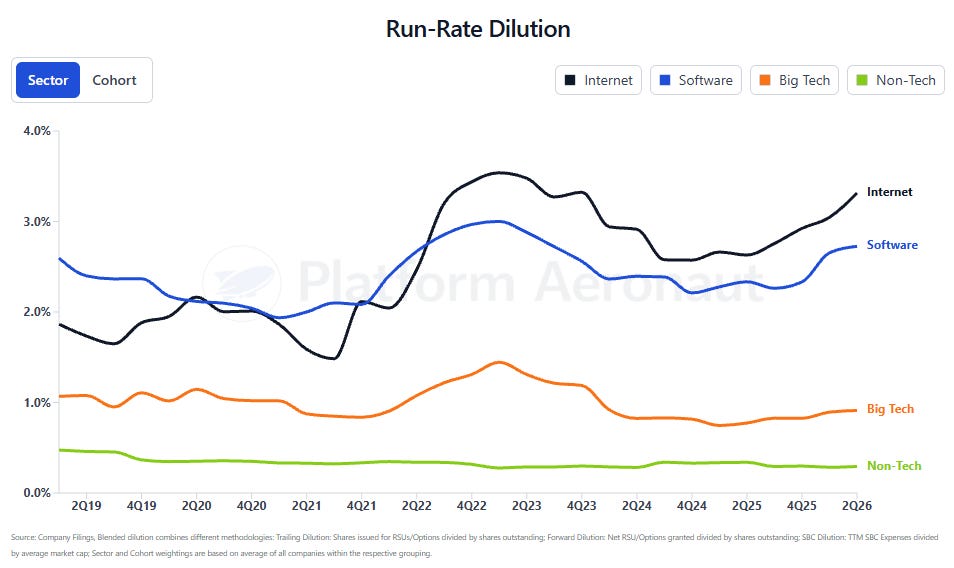
Dilution peaked in 4Q22-1Q23 mostly due to grants sized at 2021 covid-19 valuations, and as those rolled off, companies RIFed, and stock prices recovered we saw clear signs of rationalization. With the surge of AI and declining stock prices that rationalization is dead.

To view the full interactive website it’s located at https://dilution.platformaeronaut.com
Comp Problem or Stock Price Problem?
Every metric on the site is ultimately driven by share counts but the blind spot for it is that companies and employees look at stock based compensation on a $ of equity per employee. If an engineer expects $100k of equity and the stock doubles, dilution halves and if the stock gets cut in half the same comp plan looks reckless.
To help give a better lens into this I’ve added headcount and per employee metrics to every company. This allows one to look at what a company is spending on equity per head independent of what stock price is doing. Combining equity grants per employee alongside revenue and FCF per employee tells you whether the workforce is generating enough money to actually pay their employees.
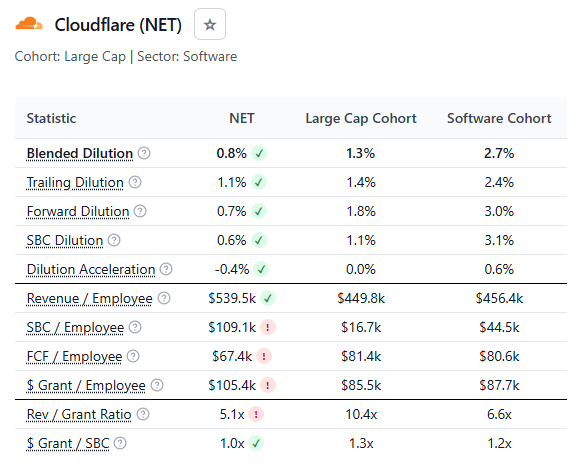
Cloudflare has 0.8% blended dilution, below its large-cap cohort on every dilution row. It looks disciplined, but then you get to SBC per employee: $109k, about 6.5x the cohort, against $67k of FCF per employee. Cloudflare pays each employee roughly $1.60 in stock for every $1.00 of free cash flow that employee generates, which is why SBC runs at 162% of FCF. Nothing in the dilution rows is wrong, the stock price is simply high enough that a very large equity budget dissolves into a small share count.
What’s New: Every company page now carries new rows for:
Dilution Acceleration: forward dilution minus trailing dilution ie. where dilution is heading vs has been
Revenue, SBC, and FCF per Employee: each benchmarked against the company’s market cap cohort and sector.
Per Employee Cohort Data
If you take per employee trends across the entire coverage space I’ve put together you get some interesting data. First is what are companies granting per employee?
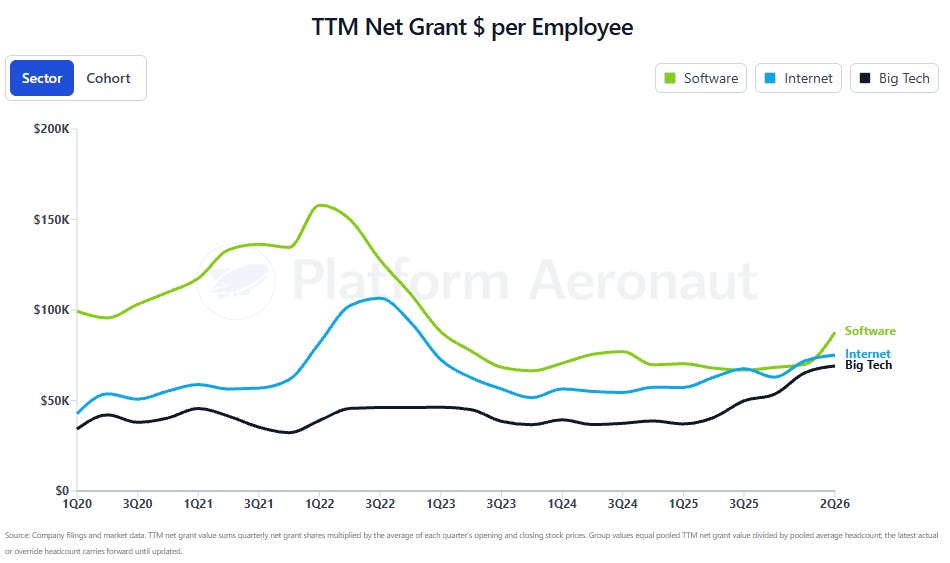
If we compare 2Q26 vs 2Q25 you can see some drastic increases in grants. The benefit of looking at it on a RSU/Option $ Grant per employee basis is that this isn’t due to stock price changes. A lot of it can be attributes to a competitive AI sector with OpenAI and Anthropic gobbling up high quality employees from the rest of tech:
Software: $88k grant per employee vs $68k a year ago (+29%)
Internet: $75k grant per employee vs $63k a year ago (+19%)
Big Tech: $69k grant per employee vs $41k a year ago (+68%)
But there’s some nuance to whether a big $ grant per employee metric is good or bad. Look at a scatter plot of Revenue per Employee vs Net Grant $ per Employee for TTM 2Q26:
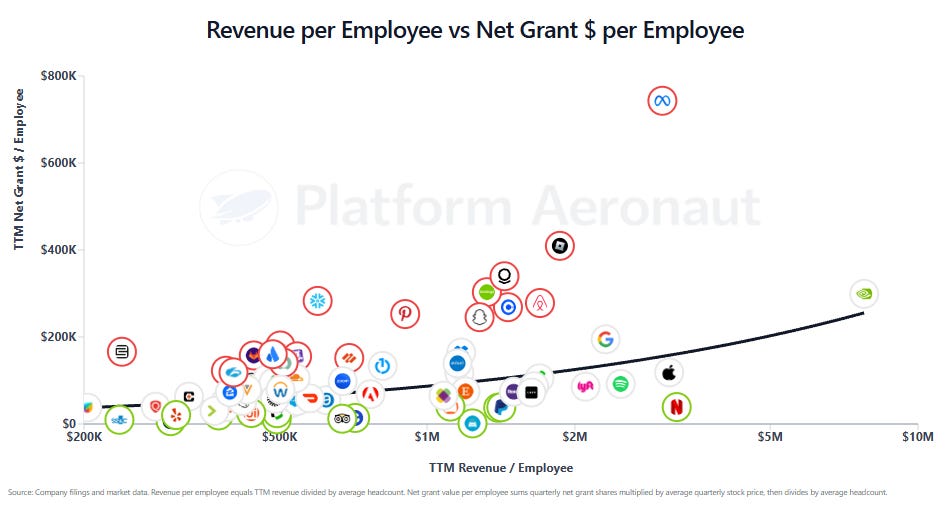
Mega caps generate about $1.0M of revenue per employee and grant approximately $69k of stock per employee. Smaller caps generate $547k per employee and grant $63k. Both sides of the equation move the wrong way at once as you go down the market cap scale: revenue per head falls by nearly half, and equity per head doubles. That’s the tangible reason small-cap dilution runs at 4.1% versus 1.1% for mega caps. Its why small caps carry the widest forward-versus-trailing gap in the tech space, and why “we’ll grow into it” does so much work in small-cap investor decks.
Pinterest: Granting way too much
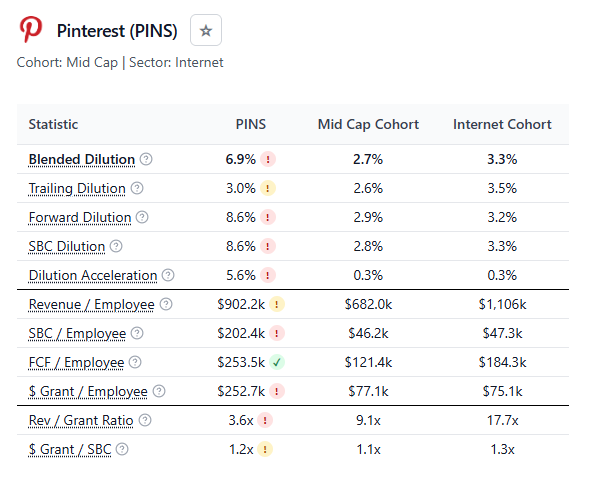
PINS granted $202k of stock per employee which is 4.4x it’s mid-cap cohort of $46k and more than 4x the rest of the internet sector. Forward dilution is 8.6% and going the wrong direction. The business is still productive with ~$900k of revenue per employee and $250k of FCF per employee, but they’re granting around 80% of FCF to employees and growth there is running way ahead of the cash the business throws off.
Nvidia as a Counter Example
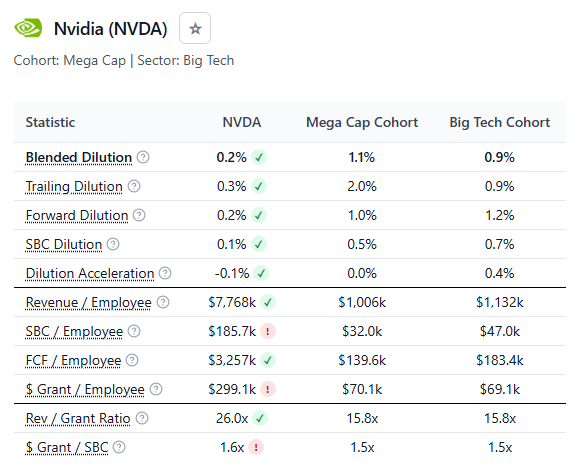
High SBC per employee is not automatically a red flag. Nvidia grants $186k of stock for each employee which is 6x the mega cap cohort, but it generates $7.8m of revenue and $3.3m of FCF per employee. The grants are enormous in absolute terms but it’s trivial relative to what each employee produces. Generous comp is fine but generous comp the company and workforce hasn’t earned is the problem. We’re increasingly moving into a world of winners and losers as we get deeper into the AI supercycle.
Sticker Shock Dilution: Snapchat, C3.ai
There’s a few companies that are seeing truly shocking levels of dilution. Snapchat everybody knows but it’s worth showing their dilution chart again because it’s wild mismanagement of the capital structure:
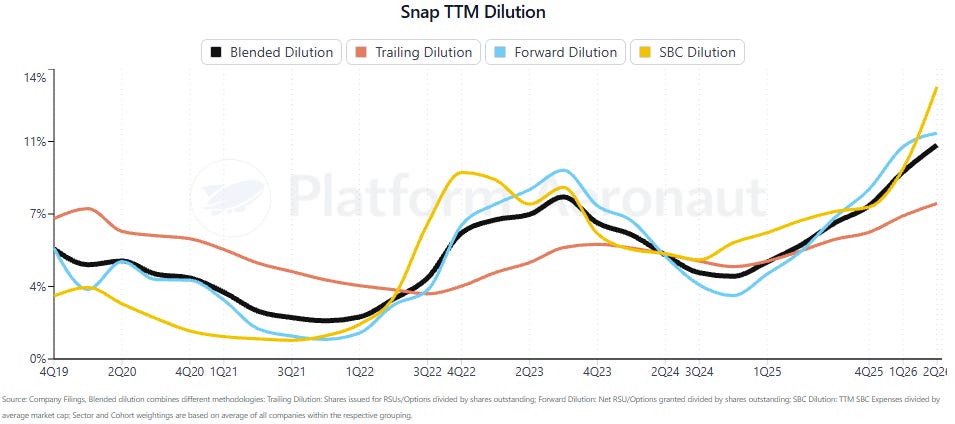
Snapchat is running at >10% annual dilution and granting 1.7x more to employees than they’re generating in FCF. Even though they’re cutting headcount it’s just not enough as the health of the business doesn’t support the compensation provided to employees (or management)
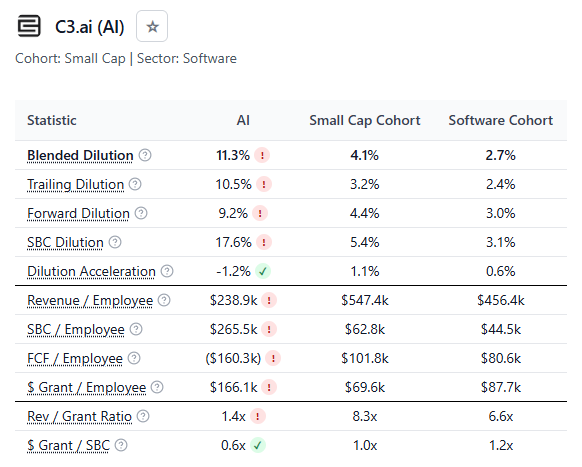
C3.ai is another shocker running at >11% dilution, generating negative FCF, and granting almost as much to employees as they generate in revenue. That’s not a sustainable equation:
Leaderboard Updates: Not big changes at the top
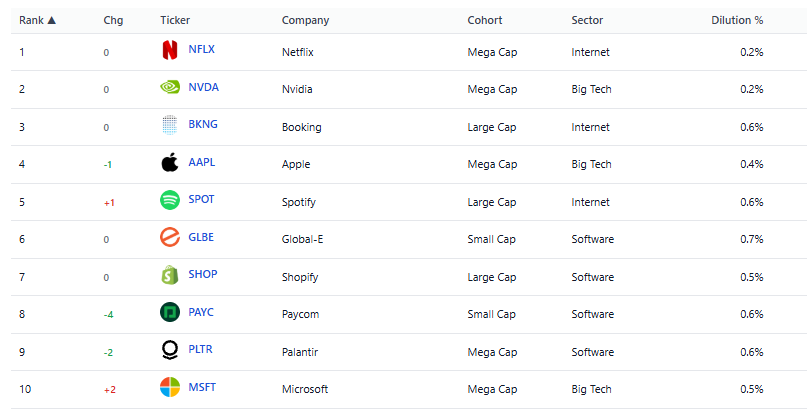
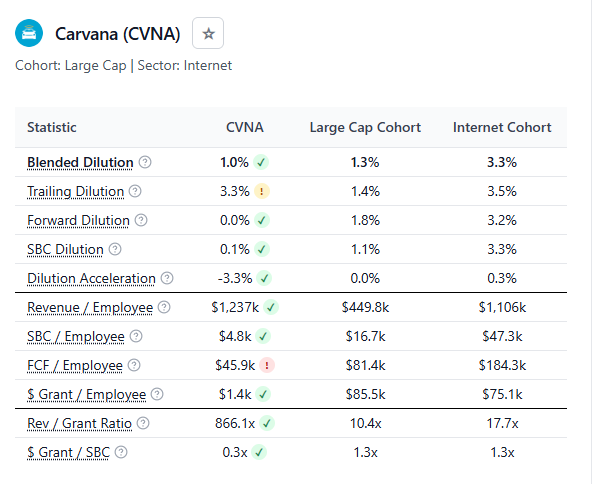
No huge material changes at the top, NFLX, NVDA, and BKNG remain the top 3 and there’s some shuffling around below that. One company moving up worth a call out is Carvana, who has made big strides in how it dilutes. It’s gone from a heavy SBC granting company (mostly to management), to post-turmoil efficiency:
How to Use Per Employee Data
The per-employee rows add three questions to the dilution checklist:
Is the dilution number being flattered by the stock? Compare SBC per employee to the cohort. If the dilution rows are green and SBC per employee is 5x the cohort, the stock is doing the work. Cloudflare today; Intuit is one to watch, at $111k per head with forward dilution already at 2.6% against 0.9% trailing.
Can the business afford its grants? Compare SBC per employee to FCF per employee. Under 30–40% and the grants are funded. Approaching 100% and every dollar of cash generation is handed back out as equity (GitLab). Above 100%, or with negative FCF per head, the company is borrowing from shareholders to pay employees (C3.ai, Cloudflare).
Where is it heading? Dilution Acceleration is forward minus trailing. Large and positive means the current grant cycle is bigger than the last one (Pinterest +5.6, Wayfair +4.8). Negative means the worst is already in the trailing window (Carvana -3.3, Robinhood -2.2).
The information presented in this newsletter is the opinion of the author and does not reflect the view of any other person or entity, including Altimeter Capital Management, LP (”Altimeter”). The information provided is believed to be from reliable sources but no liability is accepted for any inaccuracies. This is for informational purposes and should not be construed as investment advice or an investment recommendation. Past performance is no guarantee of future performance. Altimeter is an investment adviser registered with the U.S. Securities and Exchange Commission. Registration does not imply a certain level of skill or training. Altimeter and its clients trade in public securities and have made and/or may make investments in or investment decisions relating to the companies referenced herein. The views expressed herein are those of the author and not of Altimeter or its clients, which reserve the right to make investment decisions or engage in trading activity that would be (or could be construed as) consistent and/or inconsistent with the views expressed herein.
This post and the information presented are intended for informational purposes only. The views expressed herein are the author’s alone and do not constitute an offer to sell, or a recommendation to purchase, or a solicitation of an offer to buy, any security, nor a recommendation for any investment product or service. While certain information contained herein has been obtained from sources believed to be reliable, neither the author nor any of his employers or their affiliates have independently verified this information, and its accuracy and completeness cannot be guaranteed. Accordingly, no representation or warranty, express or implied, is made as to, and no reliance should be placed on, the fairness, accuracy, timeliness or completeness of this information. The author and all employers and their affiliated persons assume no liability for this information and no obligation to update the information or analysis contained herein in the future.