Instacart S-1 Deep Dive
On Friday Instacart formally filed their S-1 for an IPO we can likely expect in mid September. A deep dive on the fundamentals, unit economics, and other tidbits from the S-1
I already wrote extensively about Instacart from a high level around strategy, CEO, and historical valuation, but now that the S-1 is filed I figured it would be good to do a deeper dive on the actual numbers, comparative valuations, and the unit economics of the business today (plus some good old fashioned CEO RSU and stock comp details)
I’ll do some unit economics analysis and some comparative analysis with Doordash and Uber(eats), but this will more be interesting tidbits from the S-1 and my thoughts on some of the metrics rather than a valuation case because I’m not going to wade into the murky waters of investment advice. But if there’s any singular takeaway for Instacart is that advertising revenue is going to be the key generator of shareholder value over the next 5 years.
What the Deal Looks Like:
Goldman Sachs is lead left and JP Morgan is lead right and the ticker is going to be “CART”. Pricing, sizing, and number of shares are still level to be determined, but there are two obvious things to call out from the initial S-1 filing:
PepsiCo has agreed to a $175m concurrent private placement with the IPO which is a big positive indicator for the value they place on Instacart as a CPG advertiser.
Norges, TCV, Sequoia, D1, and Valiant are acting as cornerstone investors with indicated interest in $400m of demand for the IPO.
Given that this is likely to be one of if not the first tech IPOs after a long drought, it’s good to see support from strategics, existing, and new investors on the cover. The success (or lackthereof) of an Instacart IPO is likely to have significant downstream effects on the long list of other companies waiting for liquidity in the public markets.
Unit Economics
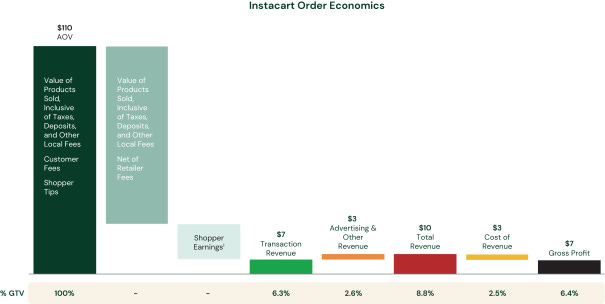
I was all ready to pull my own graphics, but the S-1 has a unit economic overview of an average basket size of $110. If we strip out the advertising and other complexity and look at the core function of the business (shopping and delivering groceries), there is $110 in AOV that gets divvyed up as follows:
$94 (86%) goes back to the Grocer/Retailer
$9 (8%) goes to the Shopper (picker + delivery)
$7 (6%) goes to Instacart as Transaction Revenue
Now a 6% take-rate on an order is about half of what DASH and UBER generate range that food delivery companies are generating but there are a few things to keep in mind:
AOV is significantly higher ($113 in 2Q23) for Instacart than it is for food delivery (DASH was $31 in 2Q23). So despite a lower take-rate Instacart actually generates higher absolute dollar revenue per order than DoorDash or Uber Eats.
Grocery margins are traditionally razor thin so less $$ to go around. This is a negative for grocery vs restaurant delivery but US spend on grocery delivery is also a bigger TAM.
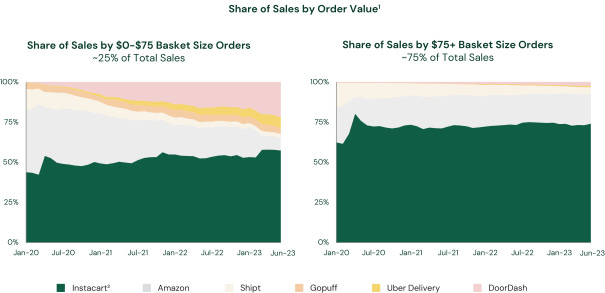
And speaking of AOVs it’s worth mentioning the different arena’s that Instacart and DASH/UBER are playing in. For grocery delivery Instacart estimates they have 75% market share of online grocery market share for orders >$75 and Uber and Doordash are nowhere to be seen. For high AOV actual grocery delivery Instacart is pretty much the only player, other peers are mostly competing in the convenience section of basket sizes <$75.
It’s unlikely that Instacart continues to see meaningful expansion in take-rate and I would expect that the current run rate of ~6% is a reasonable longer term rate. They’ve already improved the metric (6.8% in 2Q23 vs 6.4% in 2Q22 and 5.1% in 2Q21). But the key lever for Instacart isn’t necessarily the delivery fee / transaction revenue, it’s advertising.
Advertising
The single most powerful thing that Instacart has that food delivery doesn’t is advertising revenue. CPG advertising for grocery is a long established and understood part of their marketing budgets. Think newspaper circulars or even the coupon dispensers that used to stick out from the shelves at Publix or Meijers. Instacart is in a position to capture the growth in CPG brand digital spend. Compare that to DoorDash or Uber Eats needing to individually negotiate with each small restaurant to advertise a dish or location. That behavior is not something baked into the psyche for restaurants in the same way it is for grocery.
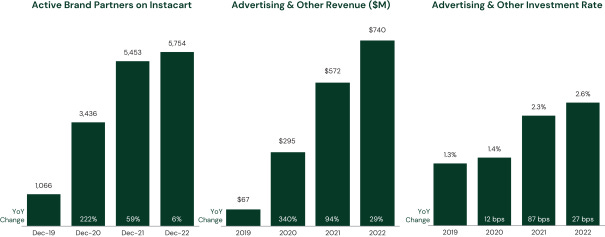
Instacart is now at a $825m/yr advertising revenue run-rate growing 20% Y/Y and >2.8% as a % of GTV. Compare that to UBER who is at $650m run-rate despite having double the GTV for delivery.
In their own words from the S-1, Instacart intends to increase their advertising revenue using the following strategies:
“Capture More Ad Spend and Add New Brands on Instacart Ads. We intend to earn a greater portion of brands’ spend across digital marketing as well as other data and customer insights. Growing the number of active brand partners and their spend will depend on our ability to grow the size and engagement of our customer base to create more clicks and impressions and to innovate on our ads offerings to deliver attractive ROI to our brand partners.”
“Grow Sales for Emerging Brands and Non-Food Categories. We intend to grow sales for emerging brands and non-food categories that have higher advertising budgets, such as household products, pet items, and personal care. As we grow sales for emerging brands and these categories, we expect to experience a mix shift towards GTV with higher advertising and other investment rate.”
And we can see early signs of this strategy as they’ve continued to grow advertising revenue as a % of GTV. It’s running at close to 3% of GTV and given the history of CPG spend at grocers and what other marketplaces are able to do (AMZN at 7-8% of GMV), it’s clear that the growth vector for Instacart is doubling the advertising revenue as a % of GTV.
The clear benefits for advertisers as simply stated in the S-1: “We estimate that on average, our ads deliver more than a 15% incremental sales lift, and in some cases twice that, for our brand partners”
Loyalty: Instacart+ & Cohorts
Some interesting statistics on Instacart+:
5.1m Instacart+ Members in 2Q23 (up 11% Y/Y)
57% of 1H23 GTV was from Instacart+ members
Instacart+ members shop at 2x as many retail banners as non-members
Instacart+ members generated 6.2x more GTV than non-members
Spend $461/mo and order 4x/mo vs non-members spending $223/mo and ordering 2x/mo
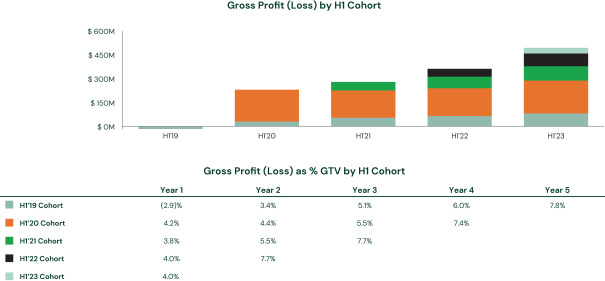
In the filing, Instacart provides a ton of cohort level data, but one of the most interesting I thought was Gross Profit (as a % of GTV) by H1 cohort showing improved profitability both over time within cohorts and over time for each new cohort:
High Level Financial Metrics and Comparative Valuation
Here is a quick comparison of Instacart, Doordash, and UberEats on LTM metrics:
I’ll caveat this quick comparison that this is only UberEats (and a lot of UberEats is international), that I’ve added back corporate overhead to Uber’s EBITDA number, and that the DASH numbers are inclusive of Wolt which skews the GTV growth significantly higher.
But the takeaways here should be
Instacart is BIG, at almost $30B it’s likely similarly sized to UberEats US business and although DASH is the clear market leader in *delivery*, CART isn’t a small fry.
Instacart profitability is better than peers and powered by advertising and better cost discipline.
The biggest concern investors will have around Instacart is the growth rate. 1Q23 GTV only grew 3% (with difficult comps from Omicron Y/Y), and 2Q23 only grew at 6%. So when peers at Doordash and UberEats are growing 2-3x that in 1H23 it begs the question of whether Instacart growth has stalled out. With the advertising revenue tailwind however, even if Instacart continues to grow GTV at mid single digits they’ve been growing revenue, gross profit, EBITDA, and FCF significantly faster than top-line GTV so GTV alone doesn’t tell the entire story.
In terms of peer valuation, at the highest levels here is where Rideshare and Delivery public comps are trading on EV / LT EBITDA:
Long term EBITDA is fairly messy and I don’t like it, but this chart is using consensus 2025 EBITDA margins as “long-term”. So I think it’s a decent barometer for where the complex is trading, which is around 16x EV/EBITDA (and a couple turns higher for EV/FCF).
If you expand the comparables to other marketplaces including online travel (EXPE, BKNG), you get a general comp set that looks like this:
It ends up being a fairly wide range from companies with leadership positions (DASH, UBER, BKNG, ABNB) to questionable LT prospects (JET, LYFT, EXPE), and Instacart will certainly fall somewhere in this range.
Capital Structure
Instacart has been around for a long time and raised at crazy high valuations. The latest 409a valuations put the per share price somewhere between $30-40 and the last 3+ rounds are likely to be underwater. At the end of the day it doesn’t matter what prices were paid in 2020-22 because the market has rationalized and Instacart can compound in the public markets post-IPO.
Additionally here is how the share ledger generally looks on a fully diluted basis at the moment, the $175m of PIPE from PepsiCo will be incremental post-IPO but if 100% of the IPO is secondary this shouldn’t change.
RSUs and Dilution
Instacart was no stranger to the dilution and equity grants inflation, but management has definitely taken discipline and dilution minimization to heart over the past year. While other companies issue significantly more RSUs when the stock price drops to offset the cash value to employees, Instacart has instead offered cash instead of RSUs and been very disciplined on how many RSUs and dilultion they’re taking with the $ value of grants for 1H23 down by over 50% from 1H22.
Tickers Mentioned: UBER 0.00%↑ DASH 0.00%↑ EXPE 0.00%↑ BKNG 0.00%↑ ABNB 0.00%↑ TCOM 0.00%↑ LYFT 0.00%↑
Resources:
This post and the information presented are intended for informational purposes only. The views expressed herein are the author’s alone and do not constitute an offer to sell, or a recommendation to purchase, or a solicitation of an offer to buy, any security, nor a recommendation for any investment product or service. While certain information contained herein has been obtained from sources believed to be reliable, neither the author nor any of his employers or their affiliates have independently verified this information, and its accuracy and completeness cannot be guaranteed. Accordingly, no representation or warranty, express or implied, is made as to, and no reliance should be placed on, the fairness, accuracy, timeliness or completeness of this information. The author and all employers and their affiliated persons assume no liability for this information and no obligation to update the information or analysis contained herein in the future.


