Airline Loyalty Program Economics & Enterprise Value
Post-covid the ballpark valuation of airline loyalty programs now composes a majority of the Enterprise Value for the big US carriers.
In the UAL Q4 Earnings call, CFO Mike Leskinen had a comment about United MileagePlus program:
“MileagePlus is a crown jewel in the businesses we have here at United Airlines. We've made some significant progress towards growing that business. We have a new leader in Richard Nunn. We have significant projects underway around data and how we can create a better customer experience and monetize that data simultaneous. And you can expect a very fulsome update on the May 1st Investor Day. We do have ideas on how to bring the market's attention to the value in the higher premium multiple that those earnings should trade at. And we have several options, and we'll share more when we're ready to share more. But we've discussed some of those. Some of those have been written about in analyst reports. And if the value is not recognized in our shares, we will take actions to highlight that value in the future -- in the near future.”
This kind of spurred me to do a review of the current and past state of airline loyalty programs, how the unit economics work, and if you apply a fair market multiple to the frequent flyer component of the business what that implies for the rest of the airline valuation.
How the Airline ⬌ Loyalty ⬌ Co-Brand Ecosystem Works
Generally airline loyalty/frequent flyer programs create a currency and issue it to consumers as a reward for flying the airline, pretty straightforward. Digging deeper there’s a much more complex ecosystem that creates a ton of value.
On the above chart there’s 3/4 major entities and everything revolves around a) the purchase of miles and b) the redemption of miles (being paid in miles for a service)
The Operating Airline
The nuts and bolts of the entire flow chart is the actual operating airline. Nobody would participate in a frequent flyer program without the benefit of being able to use their miles for travel on the operating airline. The airline purchases miles to reward their customers and sells seats to the loyalty program in exchange for the redemption of miles from customers.
The Frequent Flyer / Loyalty Program
There’s varying degrees of separation among airlines between the operating airline and the loyalty programs. United is the most “separated” having completed a debt deal in 2020 on the loyalty program. But either way, think of it as an entity that:
Owns a ton of customer data for every flier on the airline (100+ million members for the big 3)
Has the ability to issue miles to the airline at a 15-20% margin
Enacts partnerships with external entities to sell/redeem miles for the benefit of both the operating airline and consumers.
Consistently grows revenue / mile sales with minimal disruption from macroeconomic forces
Co-Brand & 3rd Party Partners
The Co-Brand partner is essentially the credit card issuer. For United it’s Chase, for Delta it’s American Express, for American Airlines it’s Citi. Co-Brand credit cards issue miles to consumers for spending using the card, and those miles are purchased from the loyalty program by the issuing bank at a set exchange rate at a 1.5-2.0x premium to what the airline itself values them at.
3rd Party partners aren’t nearly as exciting but they’re part of the ecosystem. When you book Lufthansa flights using United miles, transfer points to Marriott, or earn SkyMiles when riding a Lyft it’s essentially the airline finding a way for consumers to burn miles and generate revenue at a higher margin than by flying on the airline itself.
The Mechanics of Cash Flow from Flight Award Miles
Back when loyalty programs originated (and even a decade or so ago) it looked a lot like the below flow chart:
Flow Earning Miles from Flying: Let’s say a consumer purchases $3,000 of tickets that results in him earning 15,000 miles from the airline loyalty program. The airline books $3,000 in revenue then goes out and purchases 15,000 miles from the loyalty program at $0.012/mile for a total of $180 which are then issued to the consumer.
Flow Redeeming Miles for Flights: Now when the consumer wants to redeem those 15,000 miles for a $150 value flight, the loyalty program burns the 15,000 miles and buys a $150 seat from the airline at breakeven ($0.01/mile) and the customer gets their award seat.
Unit Economics: The unit economics are on the right side of the chart, but the operating airline generates a 9% EBITDAR margin and the loyalty program generates a 17% EBITDA margin for a company total margin of 10%. I’ll caveat that this is slightly different for every single airline, but I think it’s a reasonable view into how the economics work for awarding/redeeming miles earned from flying.
The 17% margin from the loyalty program is accretive, but not significantly so and the argument can be made that there’s a whole slew of costs borne by the airline (airport clubs, free seat assignments, status, etc) that ought to be allocated to the loyalty program. And besides, this example is 100% internal to the airline so it’s not really something worth valuing as a sum of the parts (even though I tend to dislike SOTP valuation). Little meaningful value is created just from this portion of the loyalty program’s existance any more than your grocery card or Starbucks card does.
The Mechanics of Cash Flow from Co-Brand Credit Cards
This is where the real money and margins are made. Here we introduce the Co-Brand credit card where when the consumer just goes out and spends $10,000 on anything (food, Ubers, rent) and receives miles from the airline that the credit card issuer purchases for them for $0.02/mile (a 2x markup)
Flow Earning from Credit Card Spend: There’s no associated cost for the operating airline here for most of the spend because it’s the Credit Card issuer who is paying to purchase the miles from the loyalty program.
Flow Redeeming Miles for Flights: The same economics apply here as the first flow chart. The consumer redeems 15,000 miles for $150 value of seat.
Unit Economics: The powerful force here is that the unit economics of the co-brand card relationship are considerably better. The loyalty program sells the miles to the credit card issuer for $0.02/mile and only has to spend $0.01/mile for flight award seats with the operating airline and the resulting margin is closer to 50%
From an accounting perspective here is the section from UAL’s 2022 10-K about the Co-Brand relationship:
Combining the Two: 35-40% EBITDA Margins from Loyalty Programs
Taking the two together you have the flight award portion of the business in our theoretical example earning 17% margins and the Co-Brand portion of the business earning 50% margins. In 2020 when United Airlines issues $5B in debt against MileagePlus they disclosed a ton of data in a presentation.
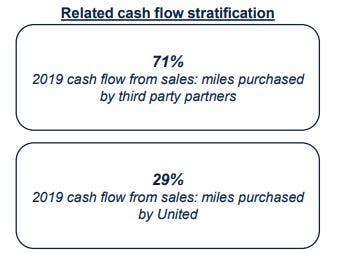
One of those chart was details that 29% of miles were purchased by United (obstensibly for flight awards) and 71% was by third party partners (read: co-brand credit cards). If we take a 30% / 70% split to my example margins of 17% and 50% you get a blended theoretical loyalty program EBITDA margin of ~40%. But does that make sense?
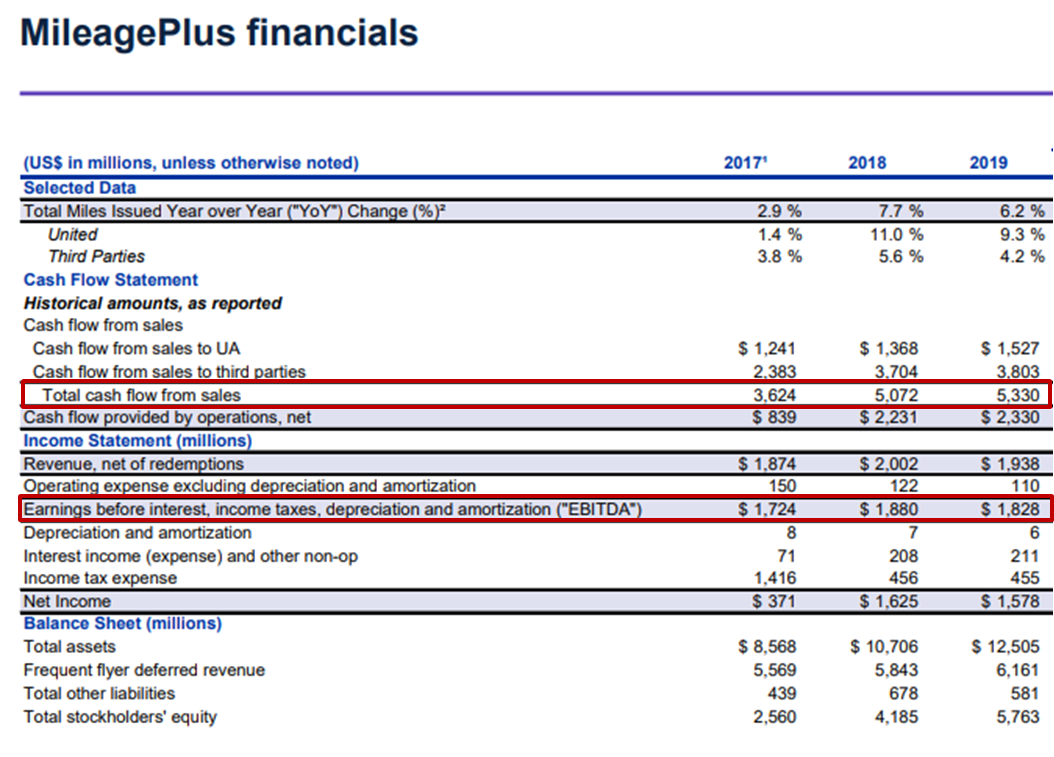
From 2017 to 2019 United MileagePlus generated 34-40% EBITDA margins when adjusting out for some mileage pre-sales in 2017. So I think there’s now a framework where you can get ballpark loyalty program revenue and EBITDA estimates for all the big US carriers. As I mentioned before this split between loyalty and core airline is likely off by some magnitude because the airline carries additional costs around airport clubs and other status benefits like free baggage/upsells. United in 2020 was pretty desperate so this likely on the far end of the spectrum towards showing the loyalty business as hyper profitable.
Airline Program Loyalty Values
The chart above shows that through most “normalized” times we saw the loyalty program valuations in the 30-40% of total company EV range. This is applying a blended 11.5x EV/EBITDA multiple to the loyalty programs which is debatable but given it’s a growth business with high margins feels reasonable. Likely a bigger multiple is fair for the Big 3 and a lower multiple for LCC (and ULCC) carriers given the strength of co-brand revenues and business traveler exposure.
Into 2023 we saw that expand so that if you did a SOTP valuation the loyalty businesses would emcompass 70% of the total enterprise value. Either one of the following must be true:
The true value of an airline is mostly it’s loyalty program and so 70% smells right
The airlines as a whole are fundamentally undervalued
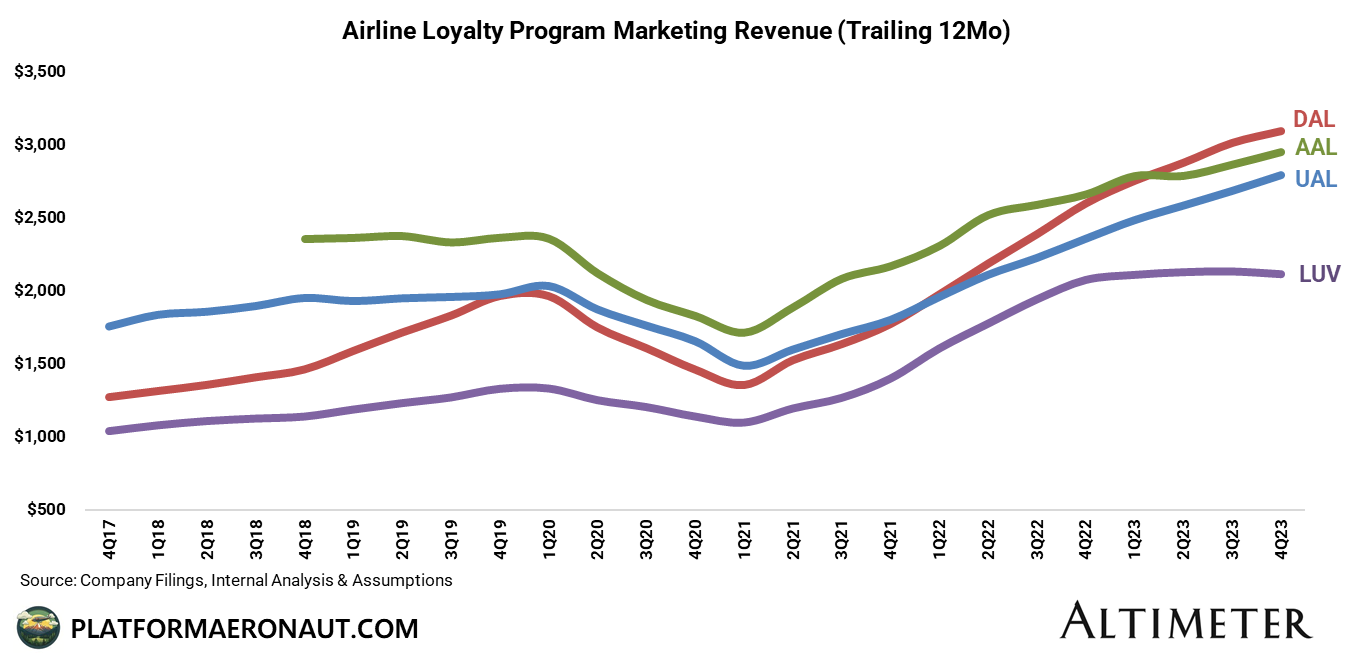
So to be transparent here this is definitely a swag with a lot of assumptions. Essentially I started first the reported airline loyalty marketing revenues from each of the 5 carriers:
Using the same sort of margins/methodology that United Airlines used in the table above from the 2020 MileagePlus Debt Financing I extrapolated those actual reported loyalty marketing revenues to the “Revenue Net of Redemptions” in the United financials (it’s around 98-99%). From that I made similar margin assumptions for each carrier which is a swag to come up with an individual airline loyalty EBITDA. From the United filing we see roughly 95% margins between “Revenue Net of Redemptions” and EBITDA. In reality the margins are closer to the 35-40% described above.
Without additional transparency from the airlines (which is difficult to get approval for from their Co-Brand partners), I think this is a reasonable set of assumptions around the metrics for the loyalty programs. Let me know your thoughts and where I may have made any mistakes since it’s a lot of assumptions. The complexity of the programs combined with slightly differing definitions and accounting is tough.
Tickers Mentioned: UAL 0.00%↑ DAL 0.00%↑ AAL 0.00%↑ LUV 0.00%↑ ALGT 0.00%↑ ALK 0.00%↑ JBLU 0.00%↑ SAVE 0.00%↑ ULCC 0.00%↑ SNCY 0.00%↑ HA 0.00%↑
Resources:
The information presented in this newsletter is the opinion of the author and does not necessarily reflect the view of any other person or entity, including Altimeter Capital Management, LP ("Altimeter"). The information provided is believed to be from reliable sources but no liability is accepted for any inaccuracies. This is for information purposes and should not be construed as an investment recommendation. Past performance is no guarantee of future performance. Altimeter is an investment adviser registered with the U.S. Securities and Exchange Commission. Registration does not imply a certain level of skill or training.
This post and the information presented are intended for informational purposes only. The views expressed herein are the author’s alone and do not constitute an offer to sell, or a recommendation to purchase, or a solicitation of an offer to buy, any security, nor a recommendation for any investment product or service. While certain information contained herein has been obtained from sources believed to be reliable, neither the author nor any of his employers or their affiliates have independently verified this information, and its accuracy and completeness cannot be guaranteed. Accordingly, no representation or warranty, express or implied, is made as to, and no reliance should be placed on, the fairness, accuracy, timeliness or completeness of this information. The author and all employers and their affiliated persons assume no liability for this information and no obligation to update the information or analysis contained herein in the future.


