

SBC Dilution Benchmarks: What the Data Actually Shows | PA Dispatch No. 14
A quick view of this week’s shifts in platforms, valuations, and AI adoption. Numbers, context, and curated reads you can use.

I added a Benchmarks page to Platform Aeronaut Dilution this week. The leaderboard and company pages are useful for evaluating individual tickers, but I kept running into a gap: there was no easy way to answer the question “is this level of dilution normal for a company like this?” Normal relative to what? Market cap? Time since IPO? Growth rate?
The benchmarks page tries to answer that. It takes the full coverage universe of quarter-level blended dilution data and groups it by company scale, IPO maturity, and revenue growth. The result is a set of reference curves that give you an empirical baseline for what dilution looks like across different company profiles.
I’ll walk through the three main charts using the rideshare and delivery cohort (Uber, Lyft, DoorDash, and Instacart) as a worked example on each one. These four companies share a sector but sit at very different points on the maturity spectrum, which makes them a useful illustration of how the benchmarks work.
Dilution By Market Cap
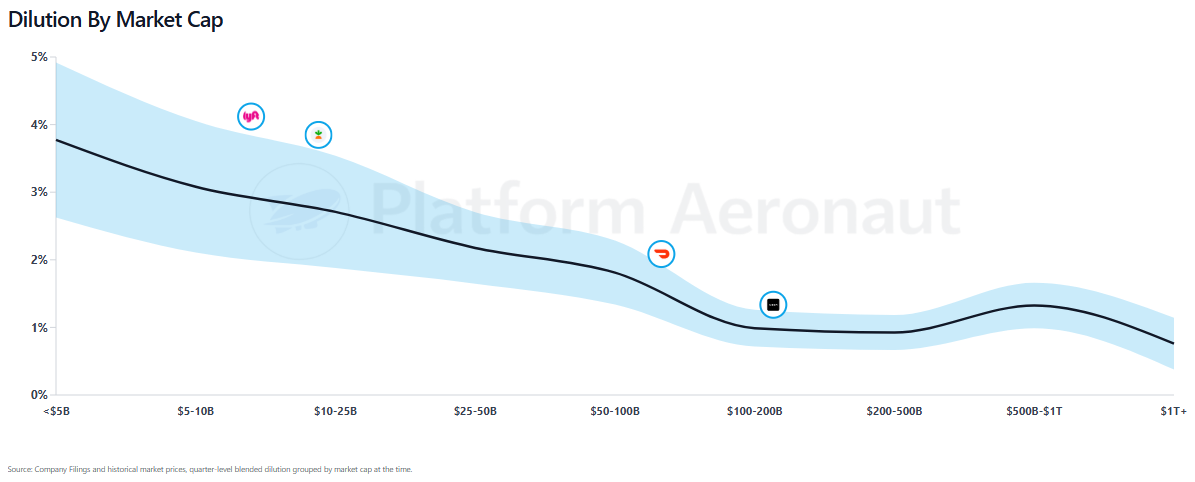
The first chart groups dilution by market cap at the time of each quarterly observation. Smaller companies dilute more. A lot more. Companies under $5B are running blended dilution in the range of 3.5–5%. By the $25–50B range, that’s dropped to roughly 2.5%. At $100B+ it flattens out around 1–1.5%, and the trillion-dollar cohort sits near 0.8%.
Overlaying the rideshare cohort tells the story clearly. Lyft, sitting in the $5–10B market cap range, is running dilution at 4.1%, right at the top of the confidence band for its size. Instacart, in the $10–25B range, is at 3.8%, also near the upper edge. Both are diluting at a rate that is high even by the standards of companies their size.
DoorDash, at $50–100B, is running at 2.1%, which is slightly above the benchmark line but still within the confidence band. And Uber, now in the $100–200B range, is at 1.3%, right in line with what you’d expect for a company of that scale.
The shape of this curve matters. The steepest drop happens between <$5B and $25B. That’s the zone where companies are scaling past the initial post-IPO grant overhang, buyback programs are starting to kick in, and comp committees are getting more serious about managing dilution. Once a company crosses into mega-cap territory, dilution converges toward a narrow band. The market basically forces convergence.
Dilution By Age Since IPO
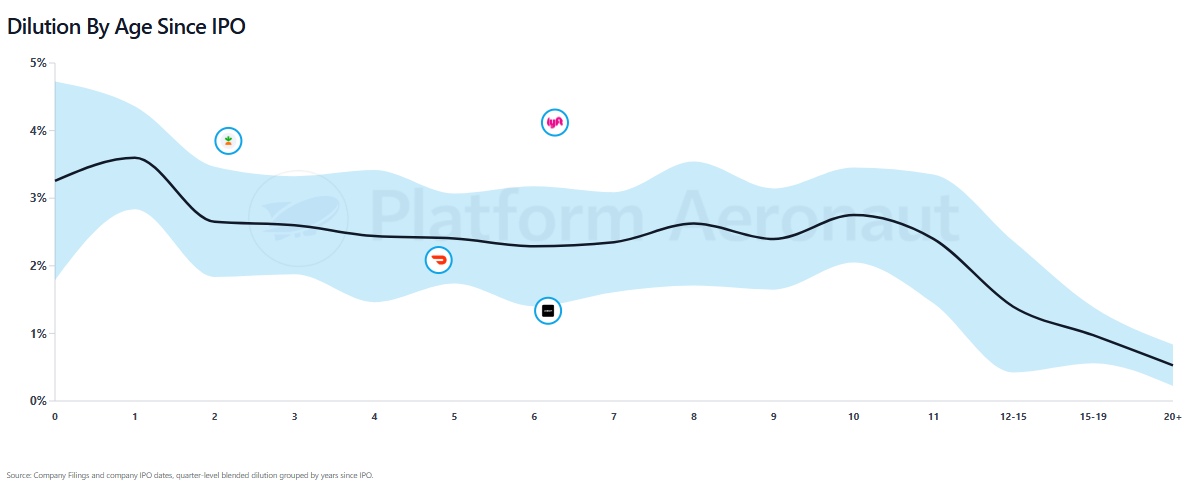
This chart groups dilution by how many years a company has been public. The pattern here is different from market cap, and more interesting in some ways.
Dilution increases slightly in the first year post-IPO, peaking around 3.5% at roughly the one-year mark as the initial wave of IPO-related grants vest. After that peak it enters a long, gradual decline. This decline is a lot shallower than I would’ve expected but this is likely reinforced by poor ZIRP behavior as companies could behave almost like children for longer.
The rideshare overlay makes the divergence in this cohort impossible to miss. Instacart, about 2 years post-IPO, is running above the benchmark line but at least partially explainable by its stage. DoorDash, roughly 5 years out, is at 2.1%, which is slightly below the benchmark for that age. Uber, at about 6 years post-IPO, is at 1.3% meaningfully below the line, which at that age sits closer to 2.5%. Uber has matured its dilution profile faster than the typical public company trajectory would predict.
And then there’s Lyft. Nearly 7 years post-IPO and running dilution at 4.1%, well above the benchmark line and outside the upper confidence band. For a company that has been public that long, this level of dilution is an outlier. The benchmark for a 7-year public company is somewhere around 2.3%. Lyft is nearly double that. This is a company that has failed to bring dilution down on the timeline you’d expect.
The confidence band is widest around years 8–11, which suggests that’s the period where company outcomes diverge the most. Some companies are actively managing dilution down by that point. Others are still granting at elevated rates, often because they haven’t achieved the stock price appreciation that would let them reduce grant volumes without cutting comp.
Dilution By Revenue Growth
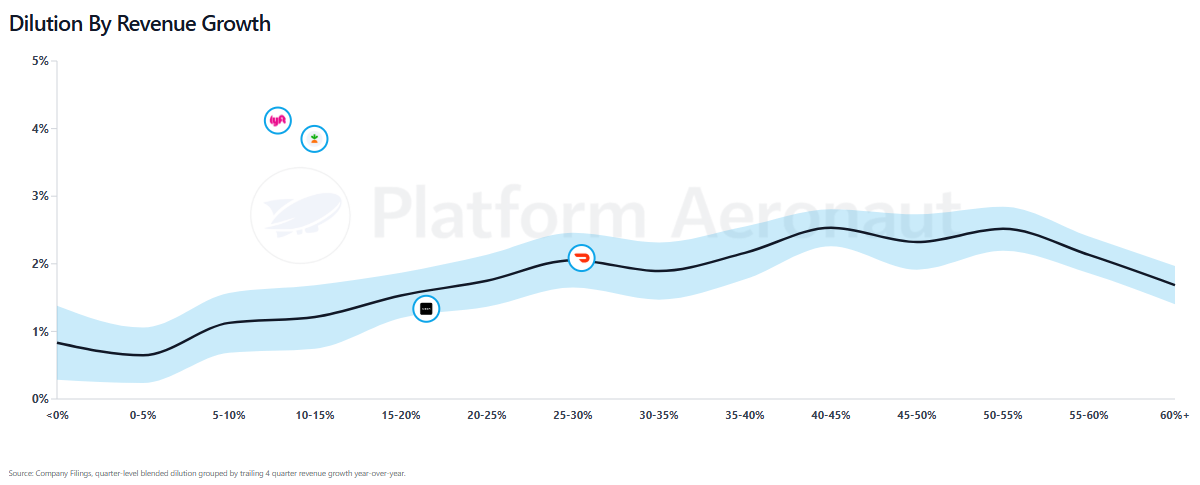
This is the chart that surprises people the most, and it’s the one I think is most underappreciated.
Dilution increases with revenue growth. Companies with declining or low-single-digit revenue growth cluster around 0.5–1% dilution. By 20–25% revenue growth, dilution is around 2%. And the fastest growers, 40%+, are running at 2.5% or higher. This makes sense as faster-growing companies are hiring aggressively, competing for expensive engineering talent, and using equity as a primary compensation tool.
But the revenue growth dimension adds something the other charts don’t: it lets you evaluate whether the growth justifies the dilution. This is where the rideshare cohort gets really interesting.
DoorDash is growing revenue around 25–30% and diluting at roughly 2.1%. That’s right on the benchmark line. Shareholders are getting rapid growth in exchange for the dilution. The trade is roughly fair by historical standards.
Uber, growing at roughly 15–20%, is diluting at 1.3%, below the benchmark line for that growth rate. This is a company whose dilution is lower than what its growth rate would typically justify. That’s a sign of SBC discipline.
Now compare those to Lyft and Instacart. Both are growing revenue in the 5–15% range, but diluting at 4%+. The benchmark for that level of growth is somewhere around 1–1.5%. They’re diluting at 3–4x the rate you’d expect for their growth profile. This is the chart that makes the sharpest case: you’re getting modest growth and elevated dilution, which is the worst combination for shareholders.
How To Use This
The benchmarks page on the site lets you overlay individual company positions across all three charts, filterable by sector and tag. The rideshare cohort is just one example, you can do the same exercise with software, big tech, or any sector in the coverage universe.
The framework is straightforward. Take any company and plot it against the relevant curve for its market cap, IPO age, and growth rate. If a company is above the line on all three dimensions, that’s a red flag. If it’s below on all three, that’s a company with stronger SBC discipline.
The full benchmarks page is live at dilution.platformaeronaut.com/benchmarks.
Performance & Valuation Snapshot
Note: Email renders these as images, click through for interactive filters or view on Platform Aeronaut.
What I Read This Week
Tripadvisor showed an end-to-end AI planning prototype at Nvidia GTC: Tripadvisor partnered with Nvidia, Nebius, and Nexla to demo a more personalized AI planning flow built around travel data, video, and data integration
The next travel SEO fight is AI visibility: PhocusWire reports brands are shifting from classic SEO toward GEO and AEO as AI answers become a discovery layer; a companion piece says nearly half of marketers report lower search traffic because of AI-generated answers.
Grab made a $600 million move beyond Southeast Asia: Grab agreed to buy Foodpanda Taiwan, calling it its first expansion outside the region and part of a broader strategy built around AI, newer services, and selective overseas deals.
Europe’s first commercial robotaxi push is forming in Zagreb: Uber, Pony.ai, and Verne said testing is already underway in Croatia; Uber will distribute rides, Verne will run the fleet, and Pony.ai says it expects more than 3,000 robotaxis across 20+ cities this year after posting its first quarterly profit.
AI has crossed into the mainstream for U.S. travelers: Phocuswright says 56% of active U.S. travelers used AI for planning, booking, or in-destination help in the past 12 months, up from 43% in late 2025 and 33% in early 2025.
Wing is bringing drone delivery to the Bay Area: Alphabet’s Wing plans Bay Area home delivery in coming months as it scales small-item and meal delivery; Reuters says the company has completed more than 750,000 deliveries so far.
Zoox is widening its U.S. footprint: Amazon’s robotaxi unit is expanding in San Francisco and Las Vegas and will start public-road testing in Austin and Miami before broader rollouts later this year.
Transcript Highlights

Adobe (ADBE) Q1 2026 Earnings Call
Generative credit consumption grew over 45% quarter-over-quarter, with Firefly usage skewing to higher-value modalities such as video (over 8x year-over-year growth) and audio (2x year-over-year growth).
“In Q1, we delivered breakthrough innovations enabling GenStudio-created assets to flow directly into activation workflows across the Adobe stack and a broad ecosystem of advertising platforms, including Amazon Ads, Google, LinkedIn, and Meta.”
Credits act like tokens across creative apps and that more users are generating higher-resolution and higher-modality content as AI becomes embedded in workflows. Cited that broader adoption, Firefly as a destination, and purchases of credit packs by creative professionals are driving the consumption increase.
HelloFresh (HLFFF) Q4 2025 Earnings Call
Tenured meal kit customers (over 50 lifetime orders) now represent 51% of meal kit orders, up from 13% in 2022 and up from 42% at end-2024 in Fabien’s comments, indicating higher revenue quality.
Marketing spend declined by over €200M in 2025, with U.S. meal kit marketing spend down more than 40% in USD as the company prioritized marketing ROI over volume.
Stock-based compensation expenses were reduced by over 30% year-on-year as part of equity compensation restructuring.
Frontier (ULCC) 2026 JP Morgan Industrials Conference
The company has four stated focus areas: rightsizing the fleet, reducing unit costs, building loyalty/repeat customers, and improving customer service metrics such as on-time performance and completion factor.
Bookings have remained resilient in the immediate period after the Iran-related oil-price spike, with the company describing no meaningful short-term booking disruption.
"You will have the front two rows with first-class seats by the end of this year."
The information presented in this newsletter is the opinion of the author and does not reflect the view of any other person or entity, including Altimeter Capital Management, LP (”Altimeter”). The information provided is believed to be from reliable sources but no liability is accepted for any inaccuracies. This is for informational purposes and should not be construed as investment advice or an investment recommendation. Past performance is no guarantee of future performance. Altimeter is an investment adviser registered with the U.S. Securities and Exchange Commission. Registration does not imply a certain level of skill or training. Altimeter and its clients trade in public securities and have made and/or may make investments in or investment decisions relating to the companies referenced herein. The views expressed herein are those of the author and not of Altimeter or its clients, which reserve the right to make investment decisions or engage in trading activity that would be (or could be construed as) consistent and/or inconsistent with the views expressed herein.
This post and the information presented are intended for informational purposes only. The views expressed herein are the author’s alone and do not constitute an offer to sell, or a recommendation to purchase, or a solicitation of an offer to buy, any security, nor a recommendation for any investment product or service. While certain information contained herein has been obtained from sources believed to be reliable, neither the author nor any of his employers or their affiliates have independently verified this information, and its accuracy and completeness cannot be guaranteed. Accordingly, no representation or warranty, express or implied, is made as to, and no reliance should be placed on, the fairness, accuracy, timeliness or completeness of this information. The author and all employers and their affiliated persons assume no liability for this information and no obligation to update the information or analysis contained herein in the future.
Forgive me for saying so, but I think you are looking at this the wrong way around.
Dilution is not normal. It should be exceptional.
If a company wants to raise capital, it has two choices: debt or equity. It evaluates both. The former is cheaper but comes with contractual repayment schedules, which may be challenging for a business with lumpy cash flows. The latter comes at the cost of dilution, but could be accretive if the share issuance is executed at a premium valuation and used to acquire lower priced earnings (perhaps an acquisition).
It all comes down to how good the CEO is at capital allocation.
In recent years, dilution has been caused by something else entirely. You allude to it. Stock based compensation. This isn't inherently a bad thing, if done well. The problem is that too few do it well. Most of the time its a wealth transfer from external shareholders to insiders. The damage is caused both by the dilution, but more commonly by the capital burned in repurchasing over priced shares to offset that dilution. This is the thing you should focus on.
To better underestand the SBC / buy back dynamic, please see: https://rockandturner.substack.com/p/the-dangerous-game-investors-are
To better understand when dilution is a good thing, please see: https://rockandturner.substack.com/p/no-dividends-and-buybacks-arent-equivalent
I hope this helps. But looking at dilution as a percentage of growth, revenue, earnings, or anything else is a waste of time and effort. It tells you nothing.
You want to evaluate the capital allocation prowess of the management. That requires more than simple ratios.